Financial Analysis Template – 70+ Financial Ratios to asses financial health of a company
$99.00
Description
Financial analysis is used to evaluate economic trends, set financial policy, build long-term plans for business activity, and identify projects or companies for investment. This is done through the synthesis of financial numbers and data.
Utilizing a bottom-up approach, this template facilitates an in-depth analysis of a particular company by examining past and projected performance as investment indicators. It assesses overall financial health, analyzes financial statements, and tracks key corporate performance indicators over time, aiding users in making informed investment decisions.
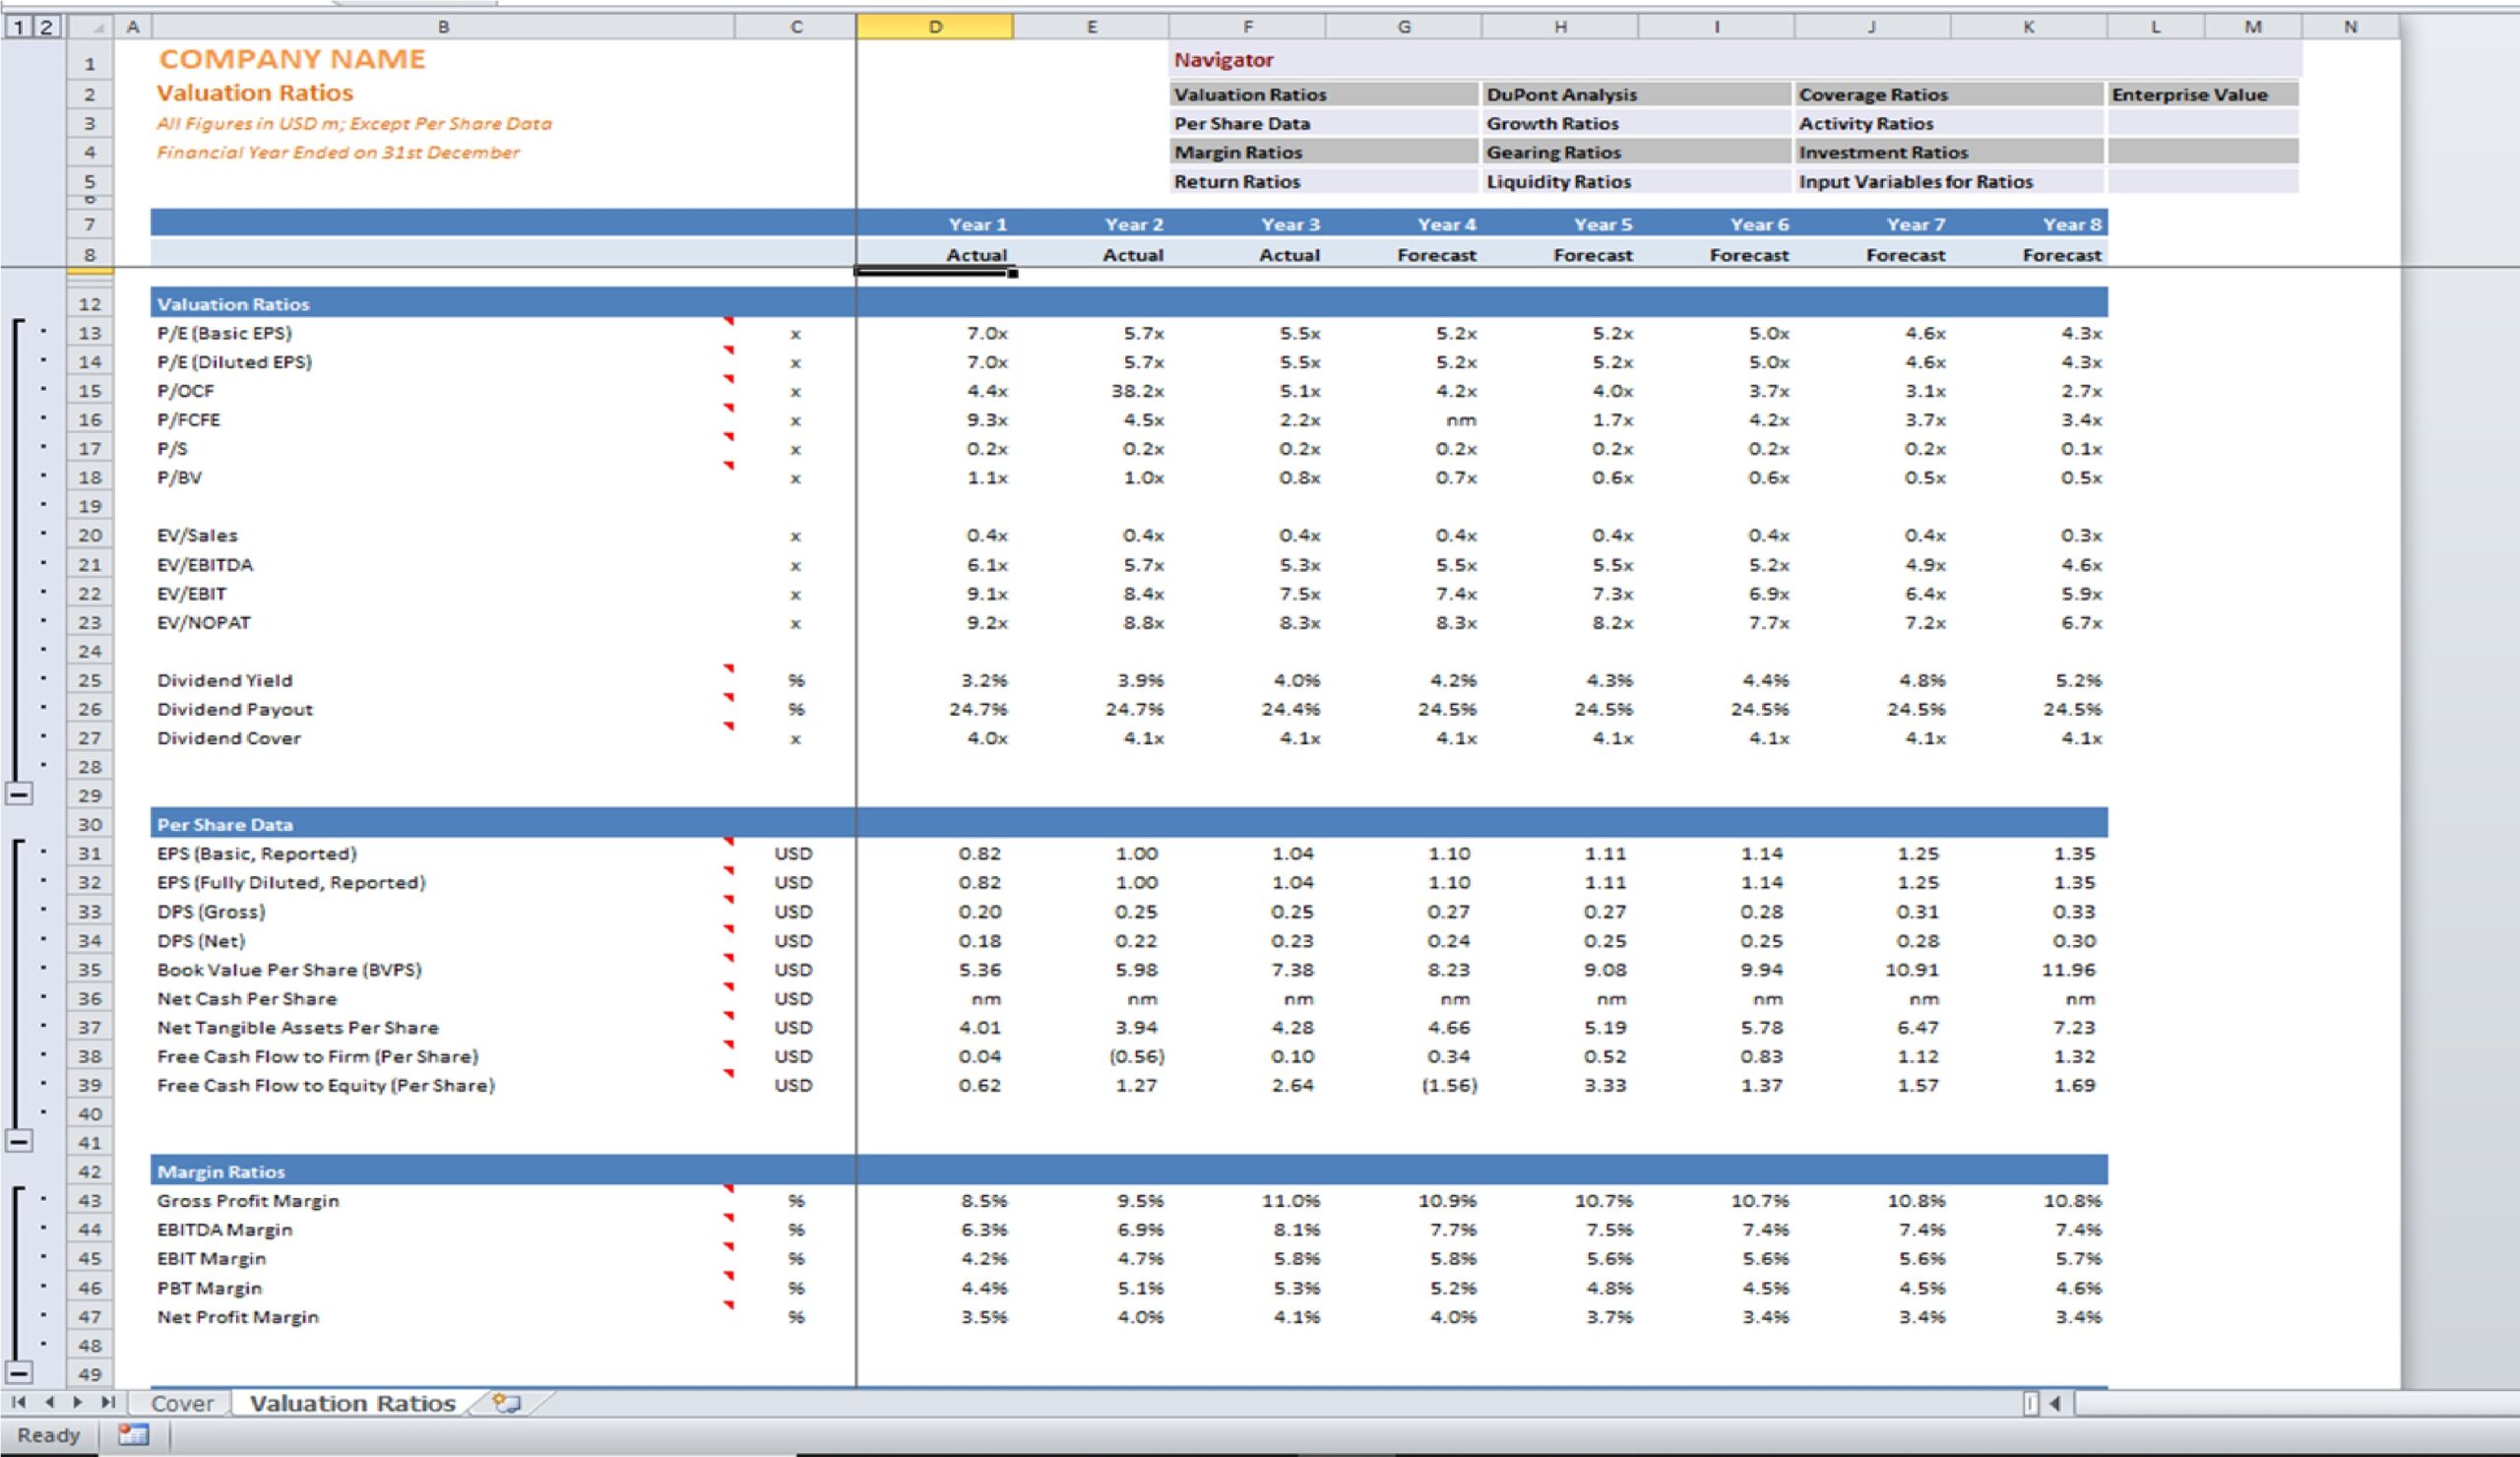
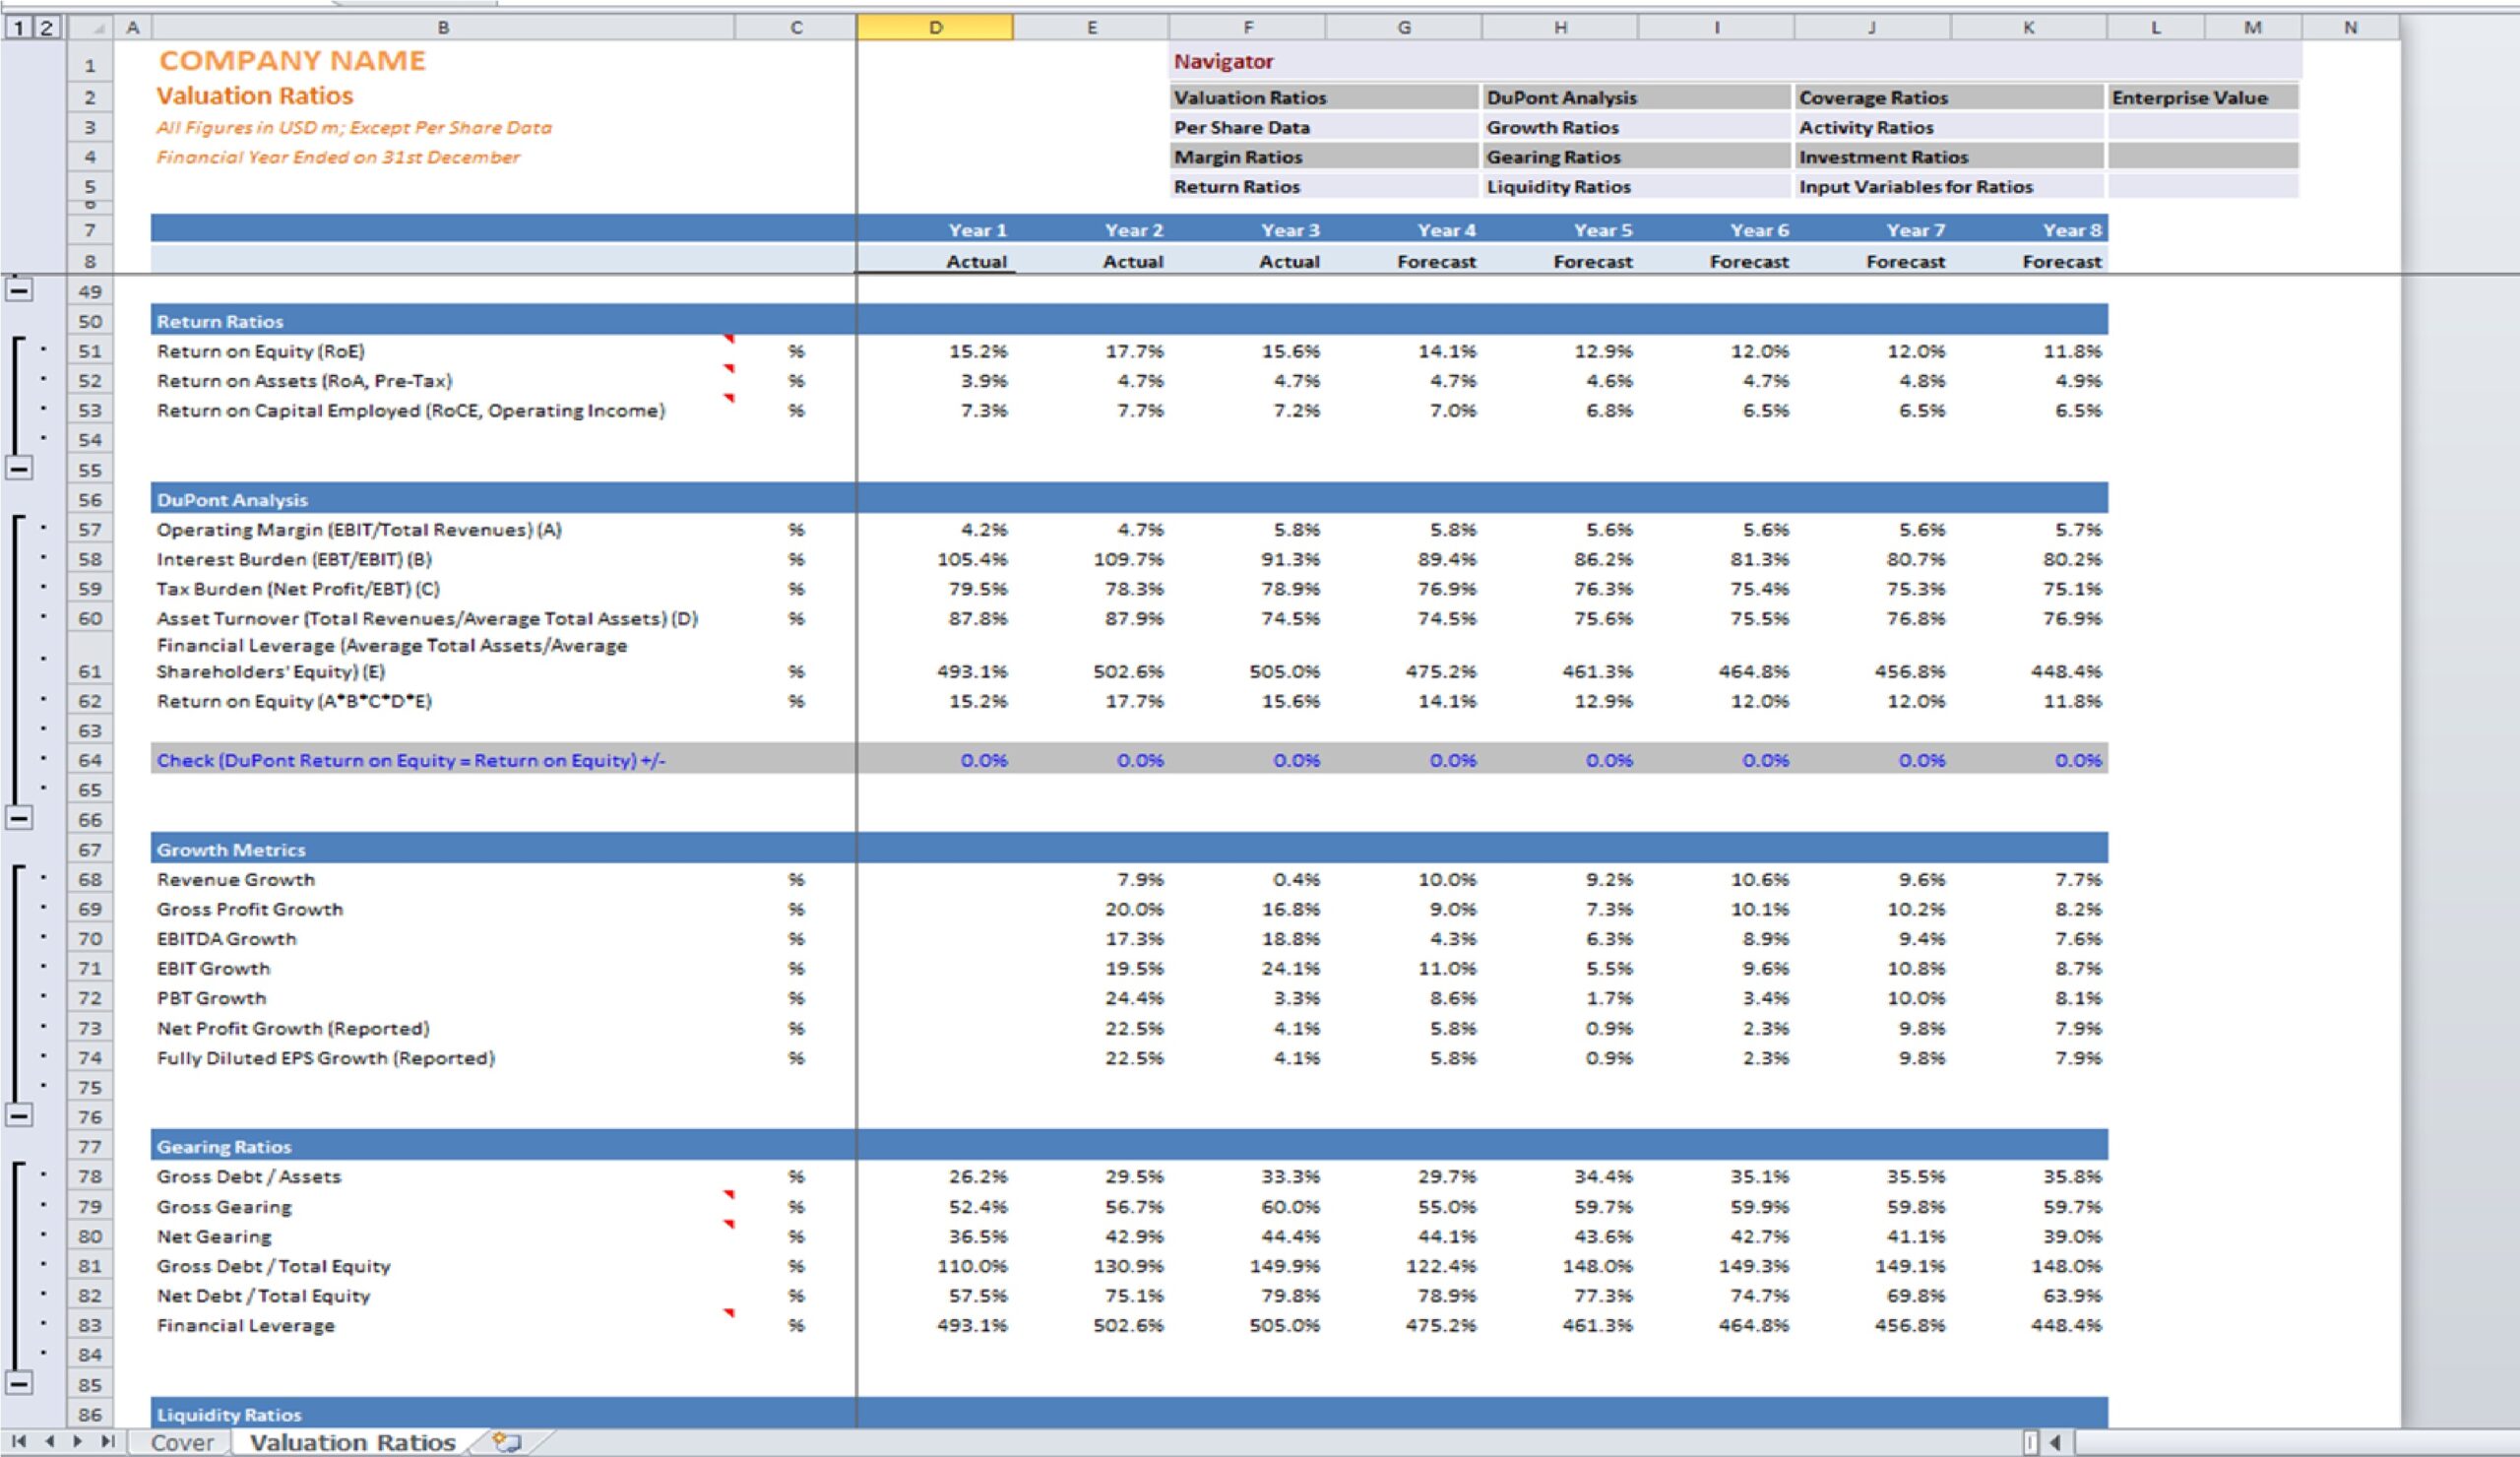
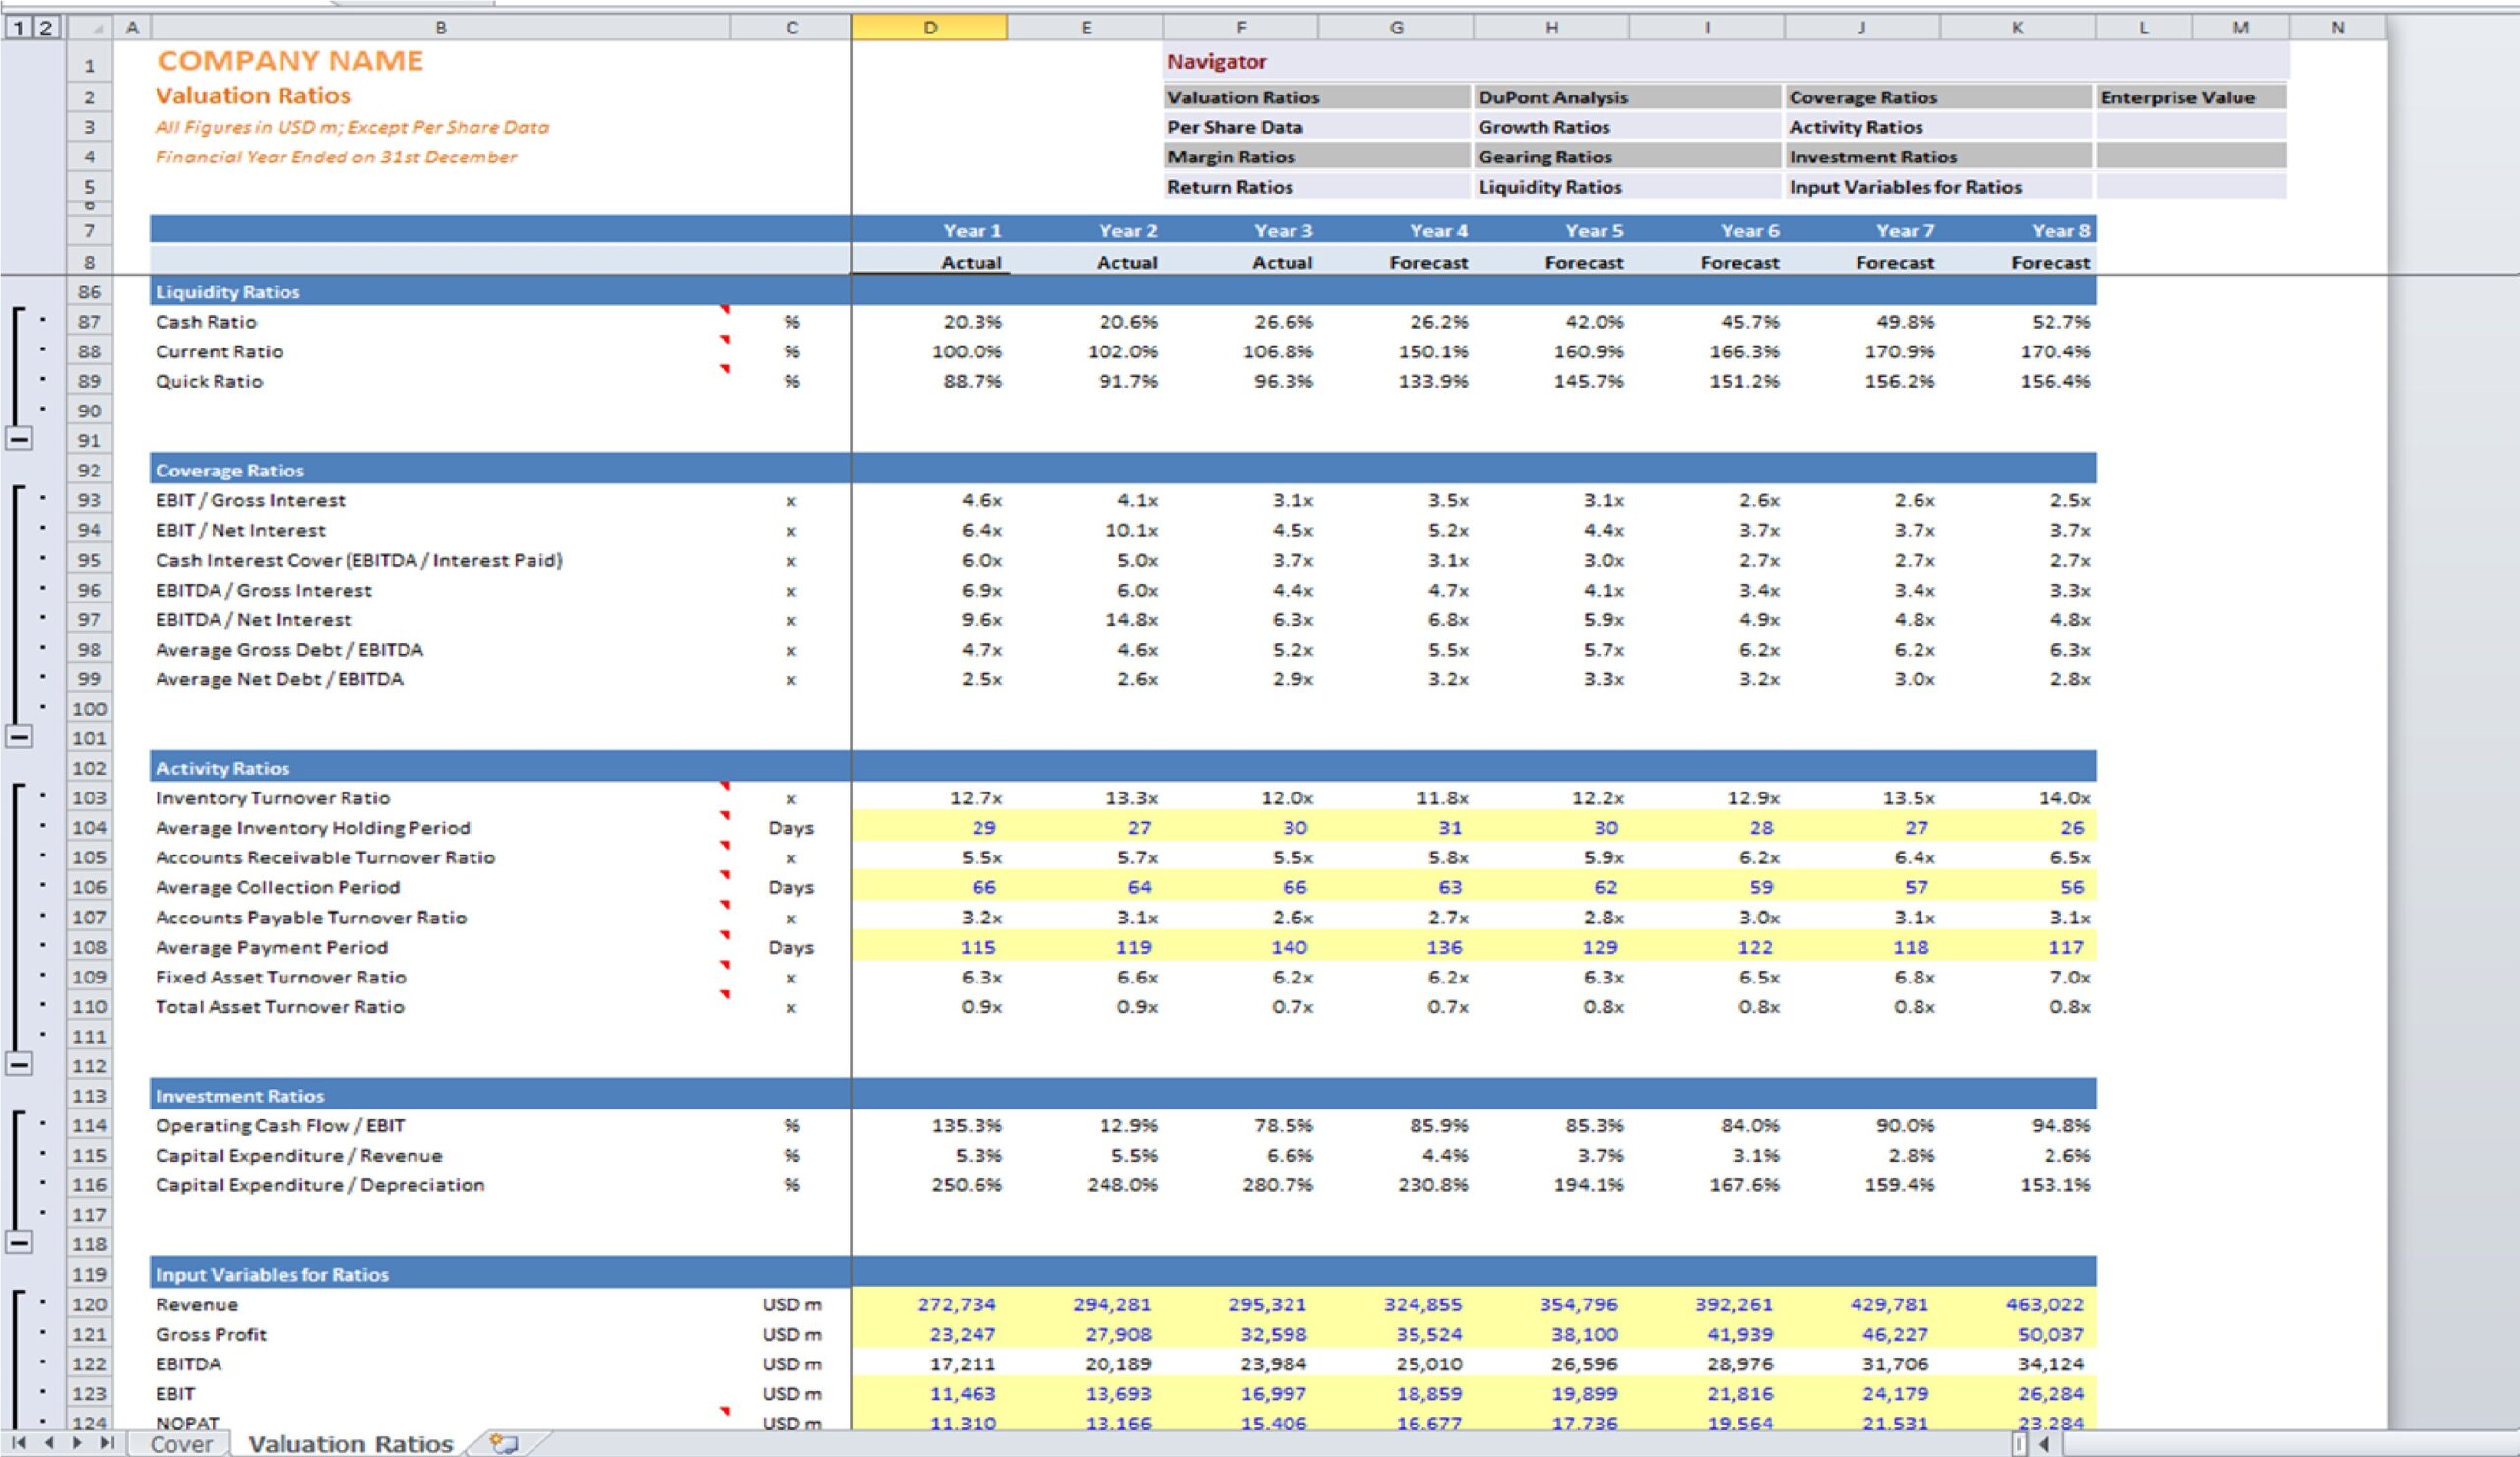
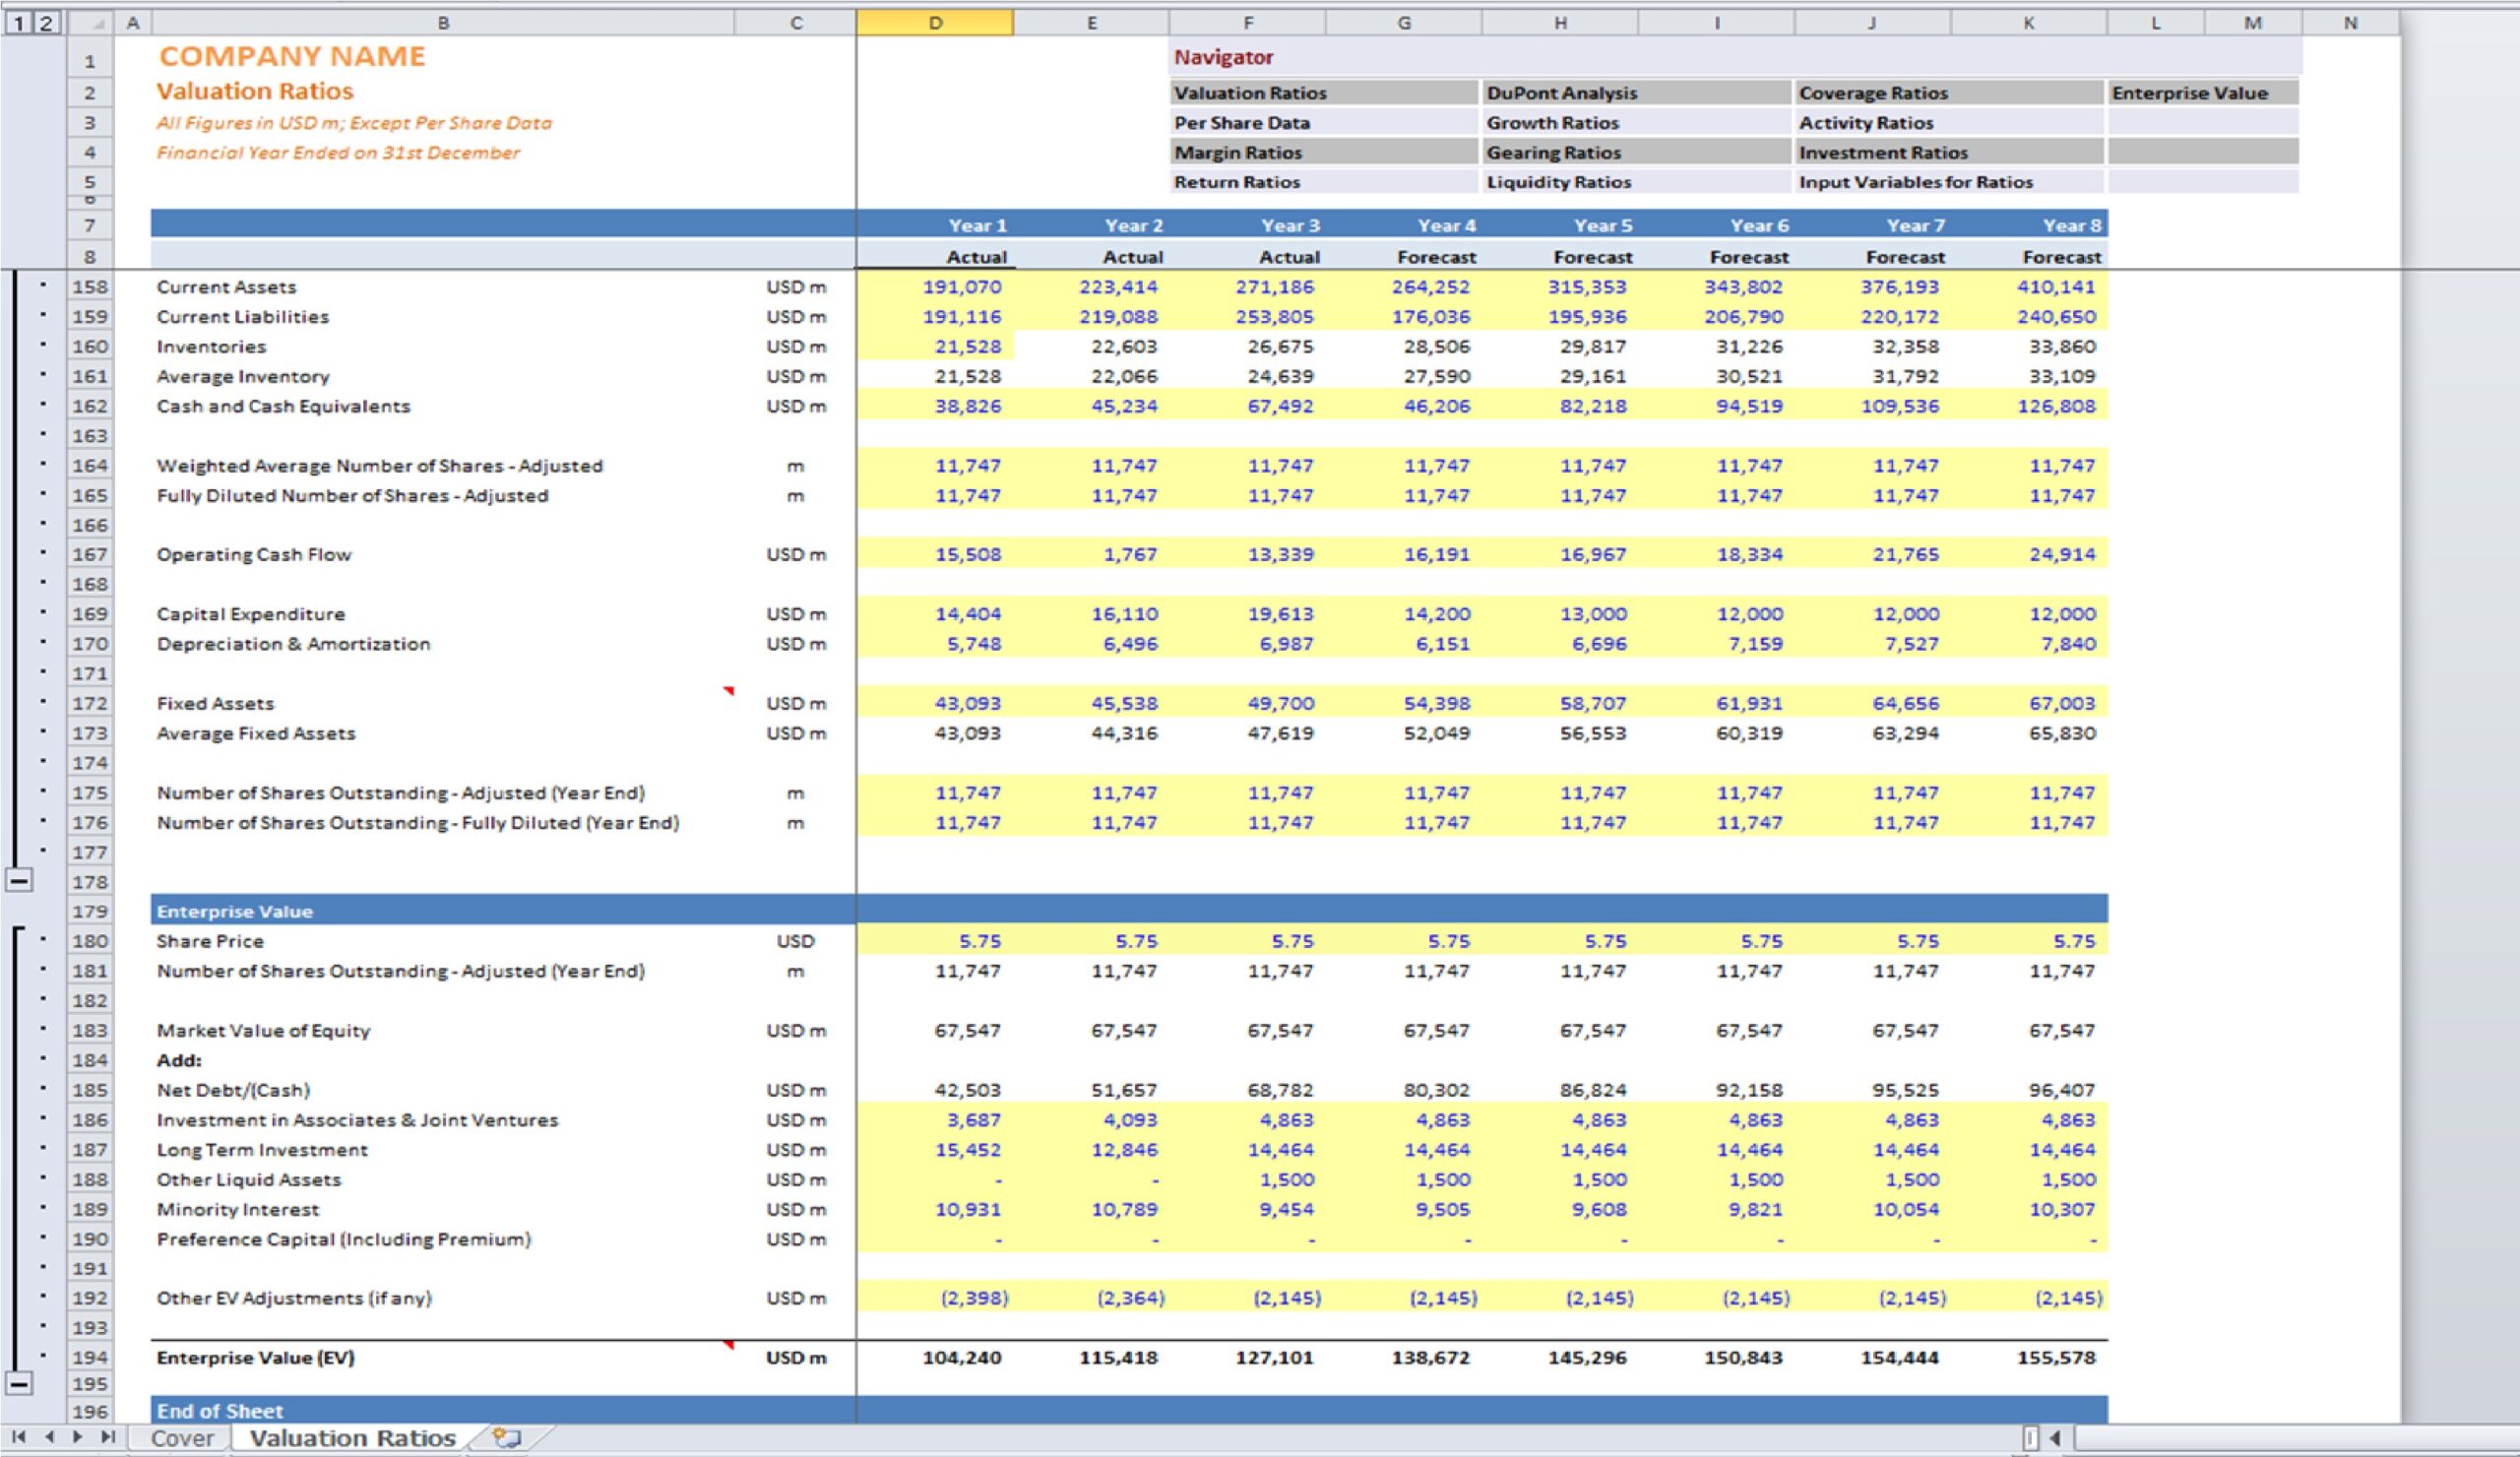
This user-friendly template allows users to input specific financial data of a company, enabling the generation of over 70 Financial Ratios organized into 12 categories.:
- Valuation Ratios (P/E, P/FCFF, P/BV, EV/EBITDA, EV/EBIT & more)
- Per Share Data (EPS, BPS, DPS, FCFF, FCFE & more)
- Margin Ratios (Gross, EBITDA, EBIT, PBT & PAT)
- Return Ratios (RoCE, RoE, RoA)
- DuPont Analysis
- Growth Metrics (Revenue Growth, EBITDA Growth, EBIT Growth & More)
- Gearing Ratios (Gross Debt/Assets, Gross & Net Gearing, Financial Leverage & More)
- Liquidity Ratios (Cash, Current & Quick Ratio)
- Coverage Ratios (EBIT / Gross Interest, Cash Interest Cover (EBITDA / Interest Paid), Average Gross Debt / EBITDA,
- EBITDA / Net Interest & More)
- Activity Ratios (Inventory Turnover, Receivable Turnover & Payable Turnover)
- Investment Ratios (Operating Cash Flow / EBIT, Capital Expenditure / Revenue, and Capital Expenditure / Depreciation)
- Enterprise Value


