Banking Model with 3 Statements – Dividend Discount (DDM) and Net Asset Value (NAV) based Valuation
$99.00
Description
This is a very detailed and user-friendly Dividend Discount (DDM) and Net Asset Value (NAV) based valuation model for the banking sector. The template is included with the three financial statements i.e. Income Statement, Balance Sheet, and Cash Flow Statement, and detailed calculations around valuation and financial analysis.
The model captures 3 years of Historical + 5 Years of the forecast period. Valuation is based on the 5-year forecast using the Dividend Discount Model (DDM) and Net Asset Value (NAV) approach.
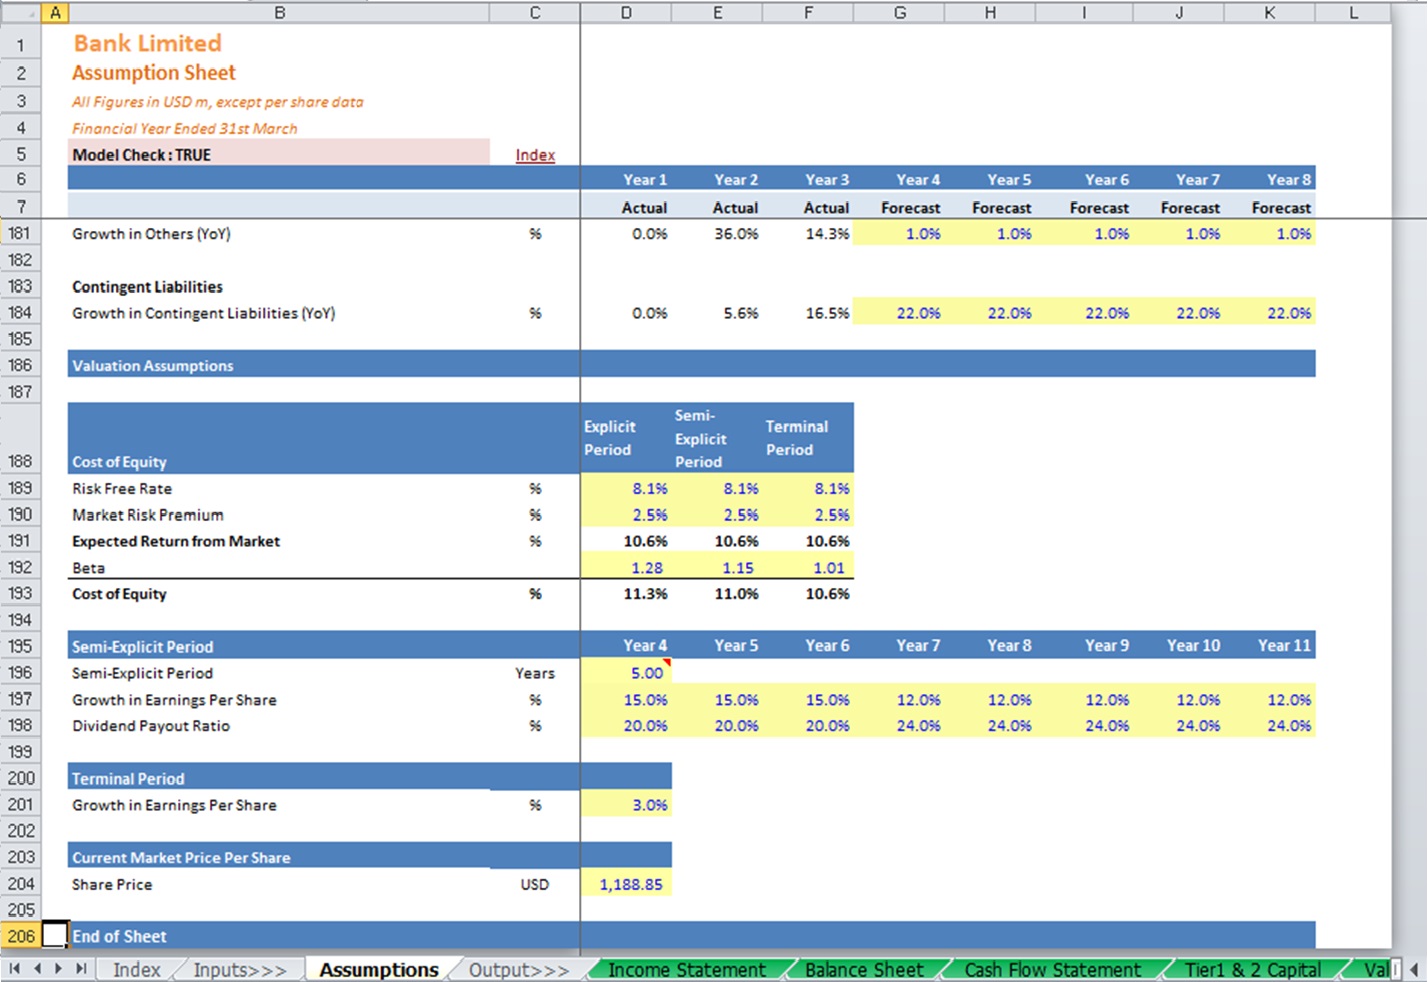
DDM is a method for valuing the price of a stock by using projected dividends and discounting them back to present value. The concept is that if the value obtained from the DDM is higher than the current market value of the stock, then the stock is undervalued, and vice-versa.
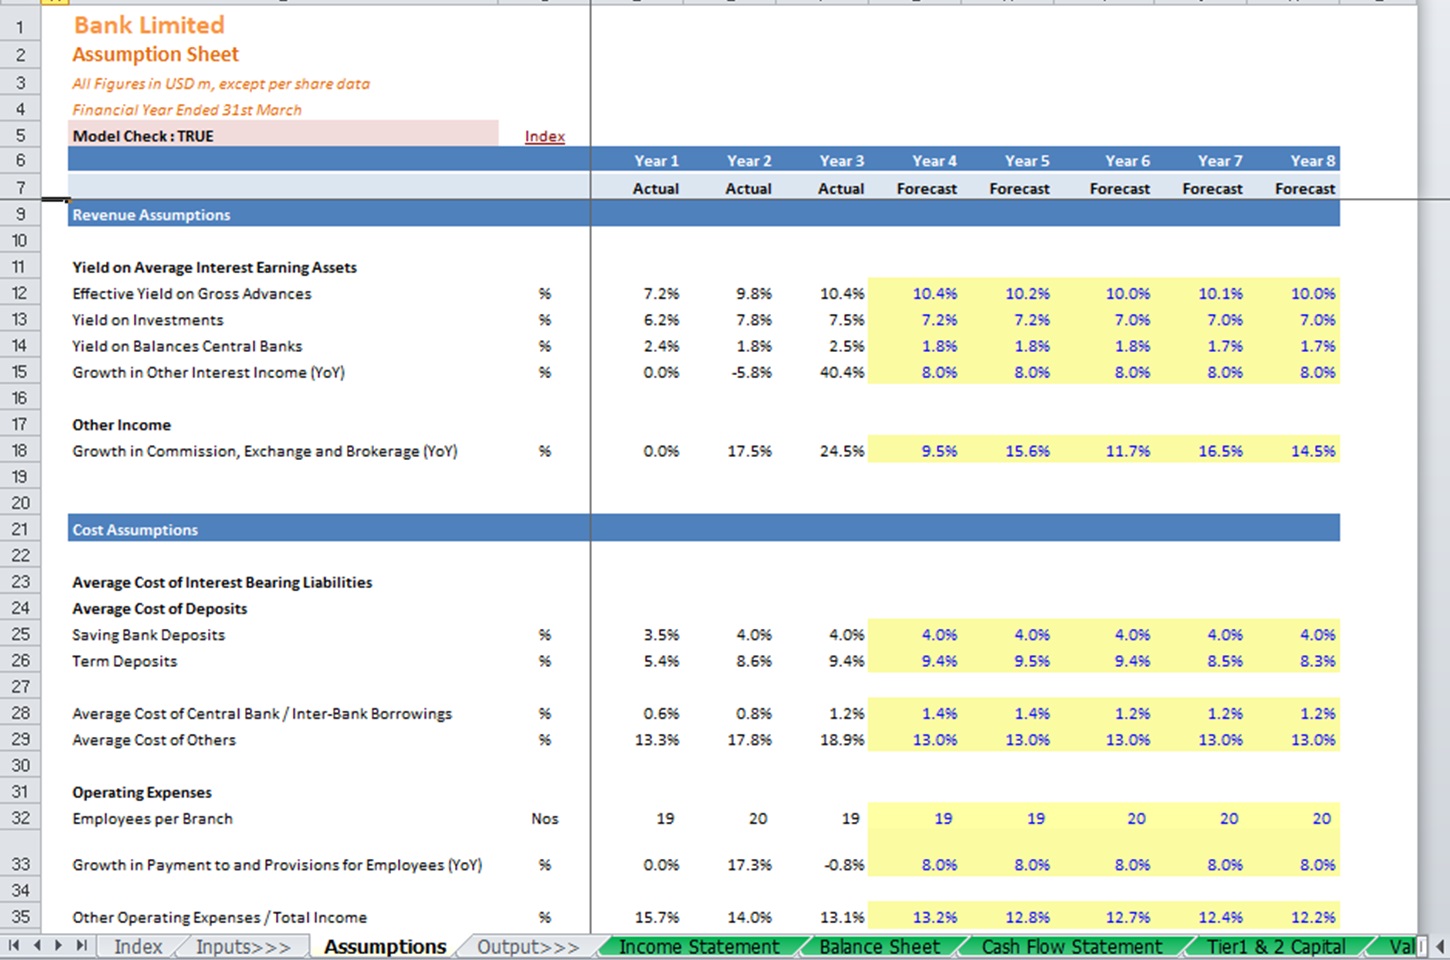
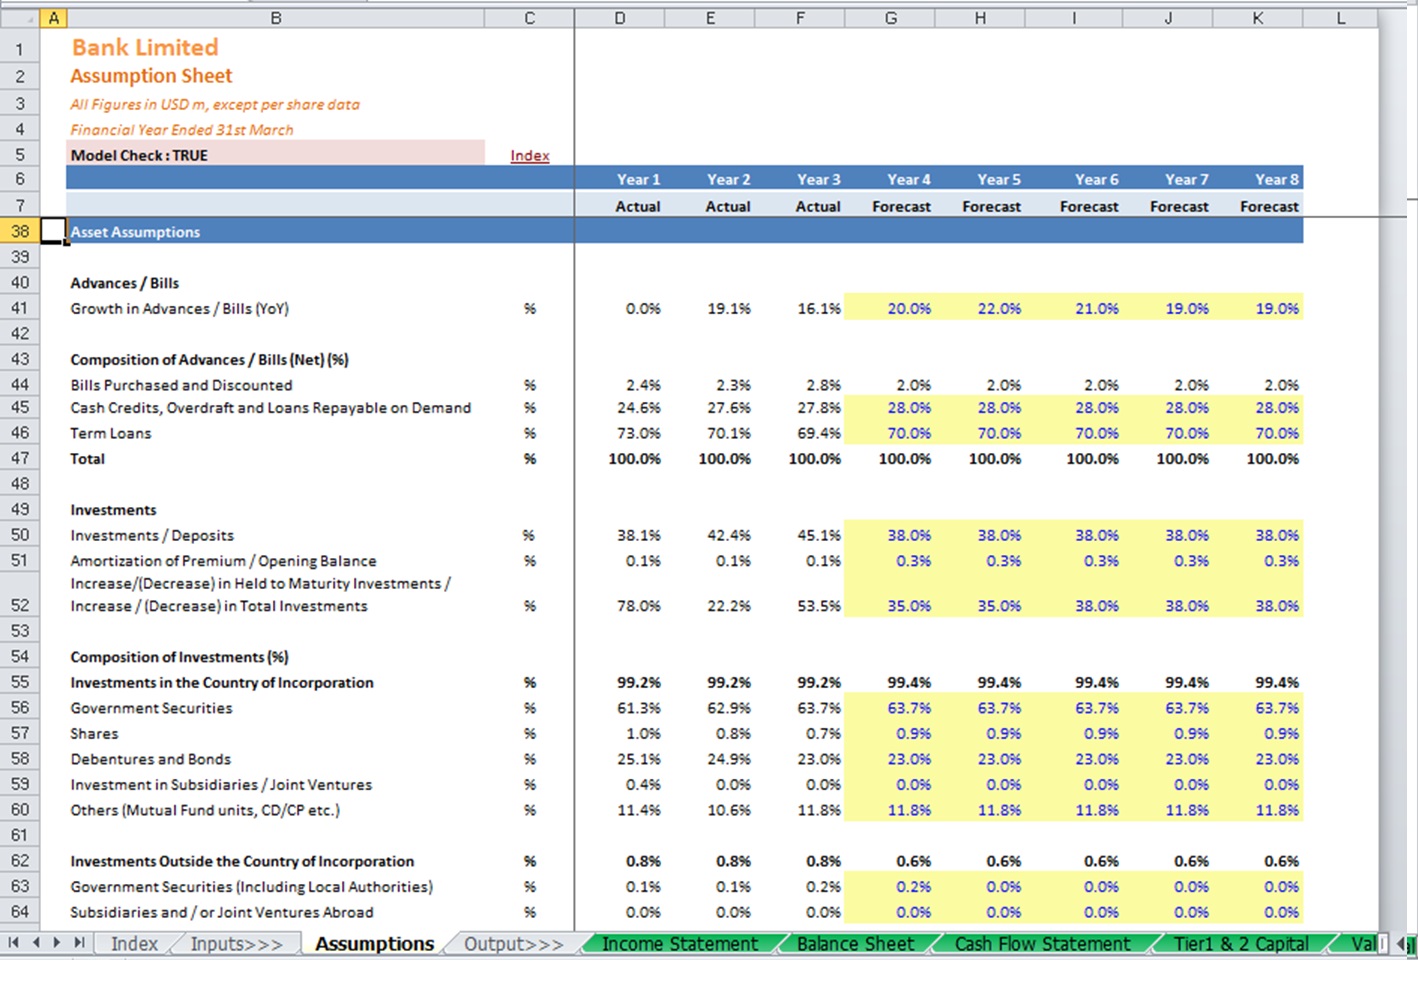
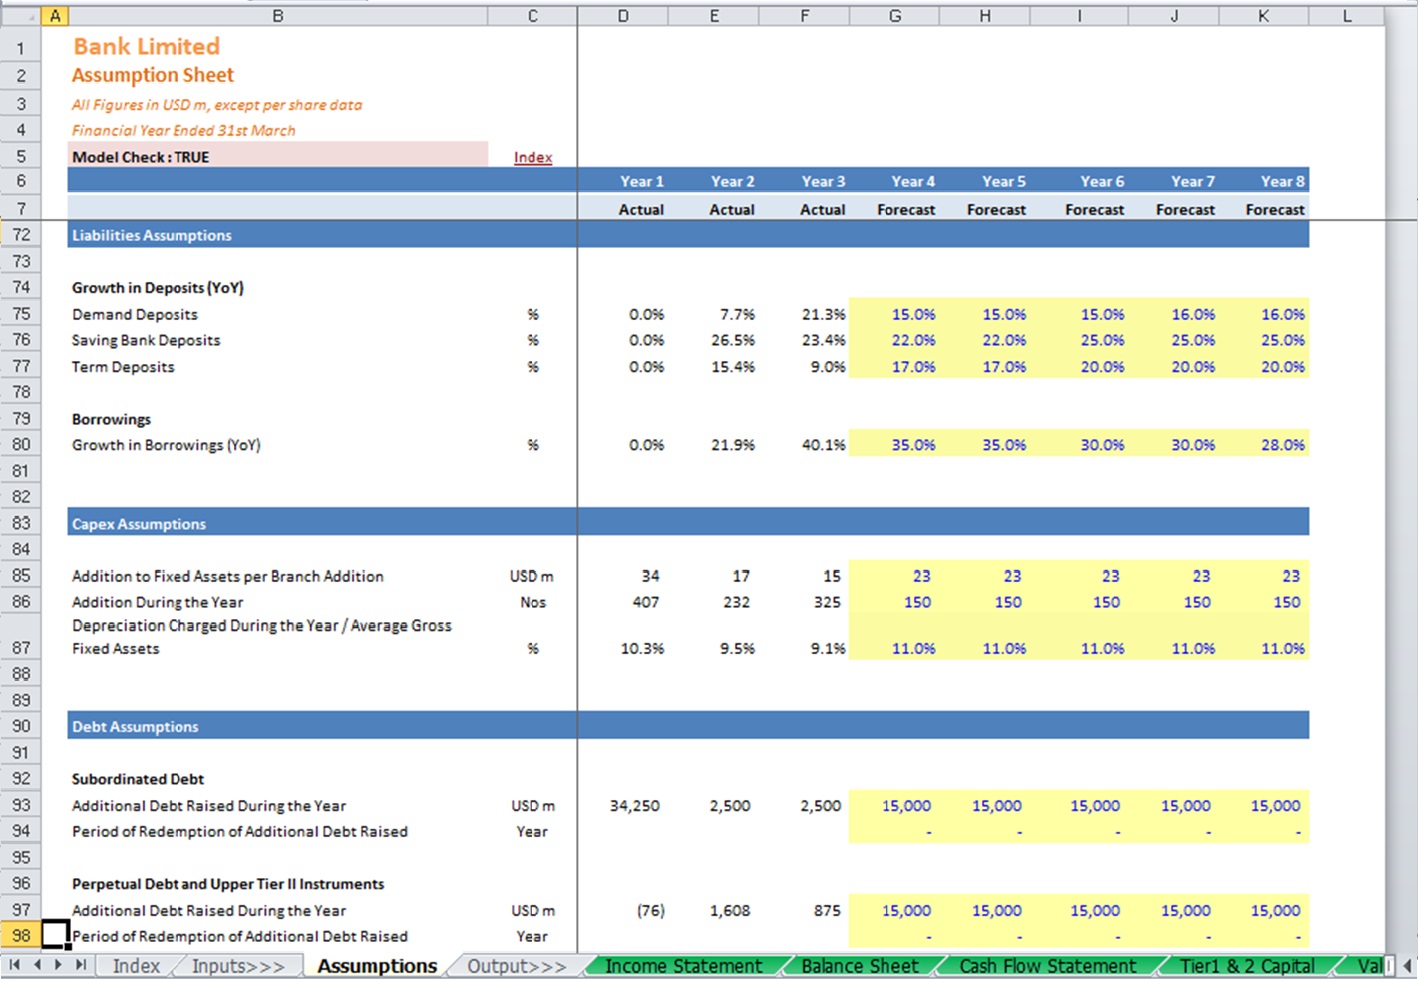
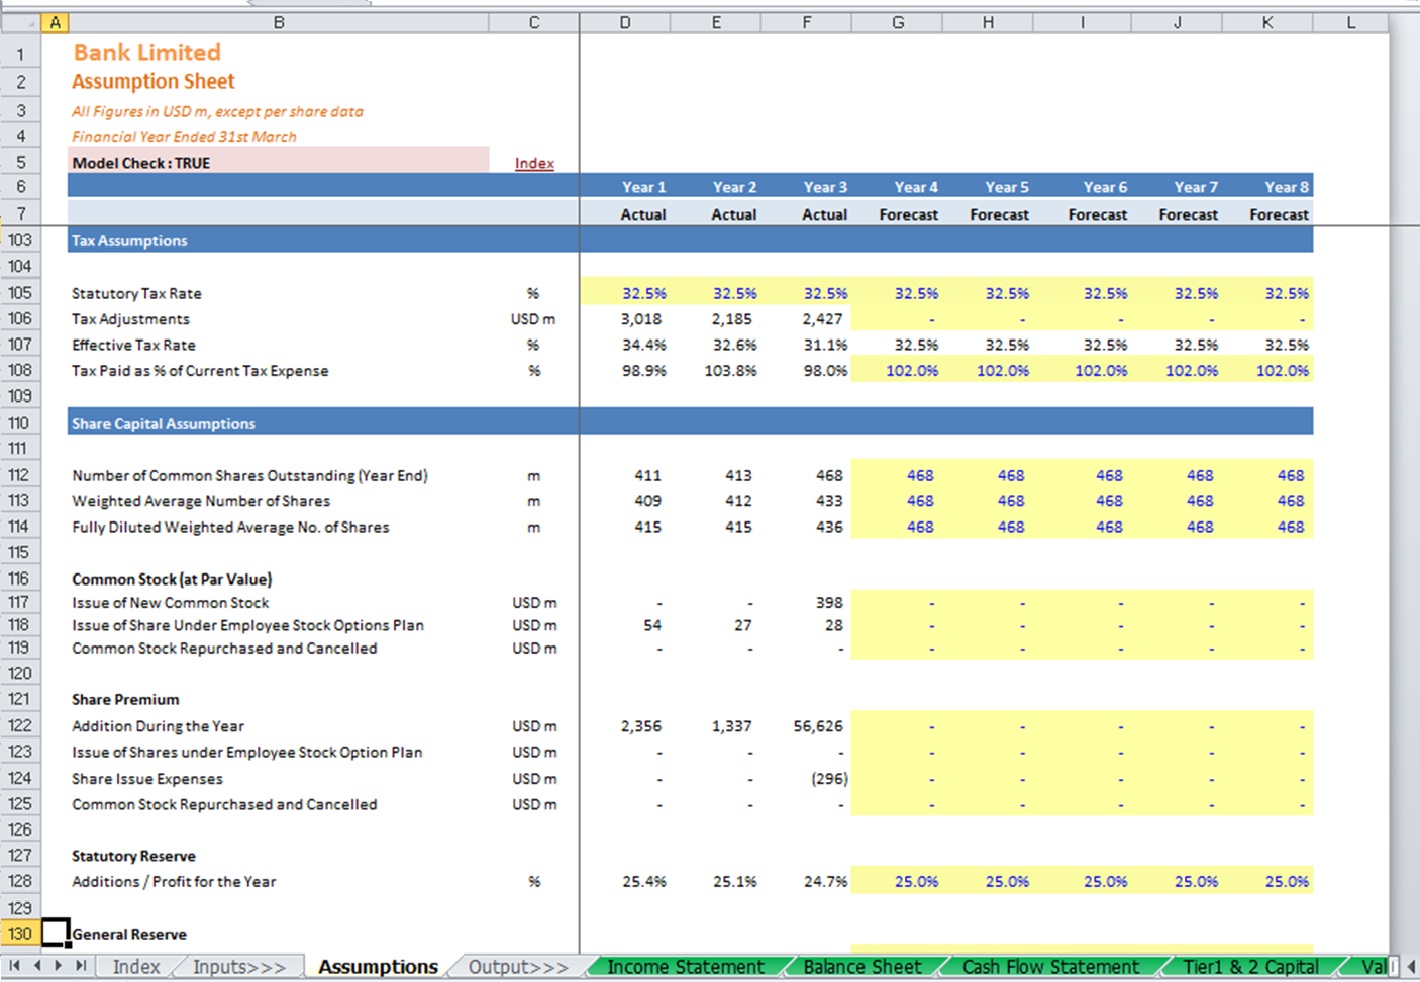
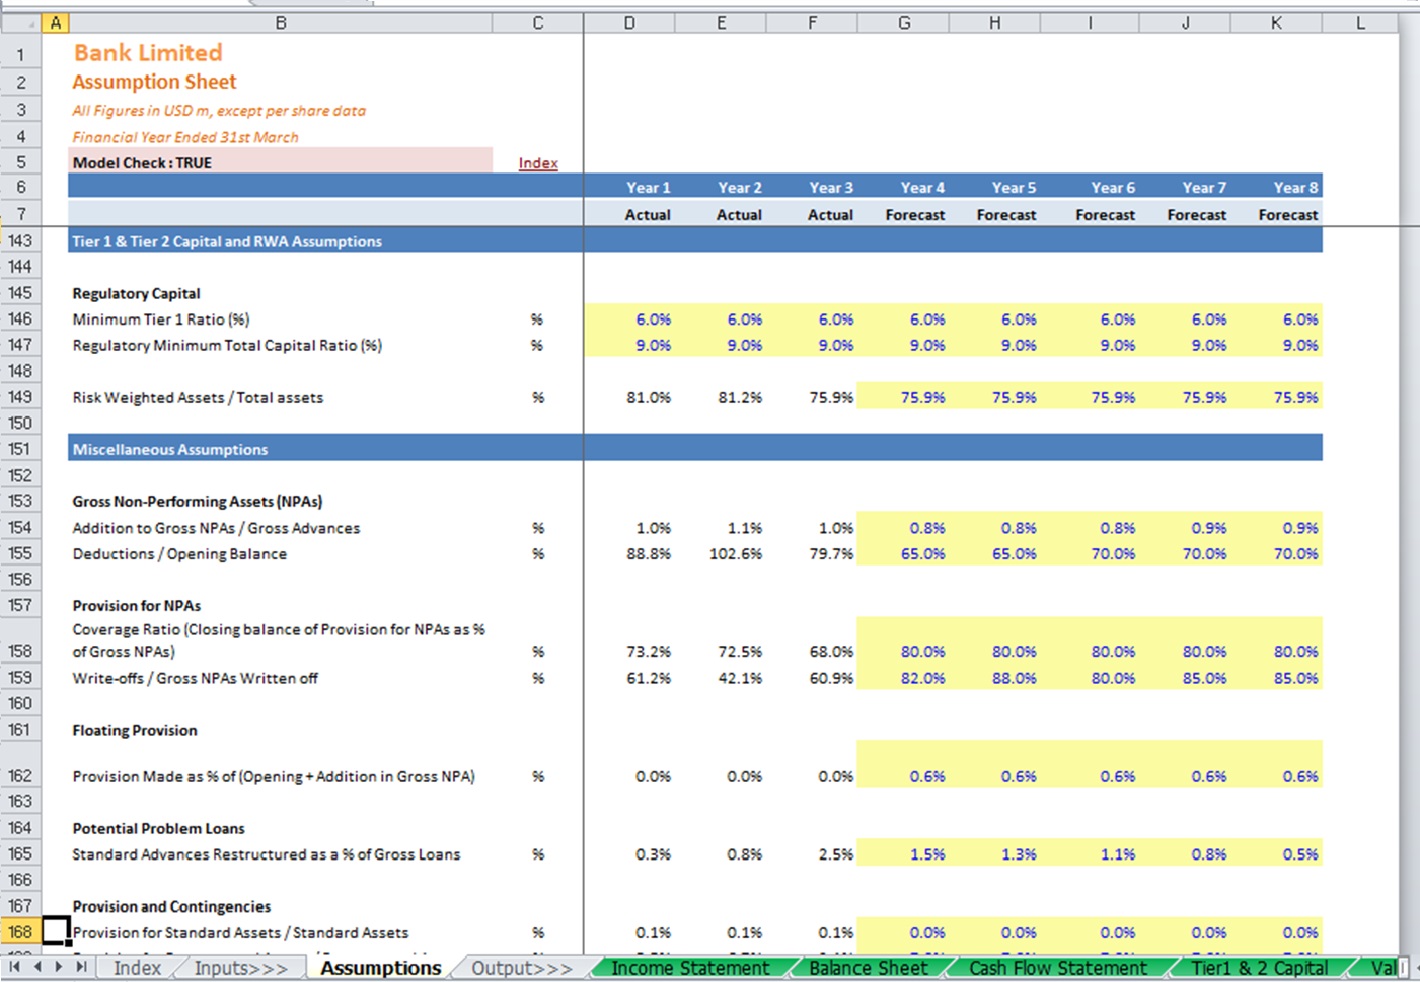
The assumptions tab allows for the input of a huge amount of financial data for your business. These inputs cover a wide range of financial data:
- Revenue Assumption (Effective Yield on Gross Advances, Yield on Investments, Gross Advances & more)
- Costs Assumptions (Interest on Deposits, Average Interest bearing Liabilities, Employee Cost & more)
- Income tax
- Capital Expenditure and Depreciation/Amortization (Tangle and In Tangible Assets)
- Long-Term and Short-Term Debt
- Share Capital (Issue of New shares, Reserve Accounts)
- Dividend Calculation (Interim and Final Dividend along with Tax impact)
The model runs comprehensive calculations based on the inputs provided by the user to generate very accurate outputs which include:
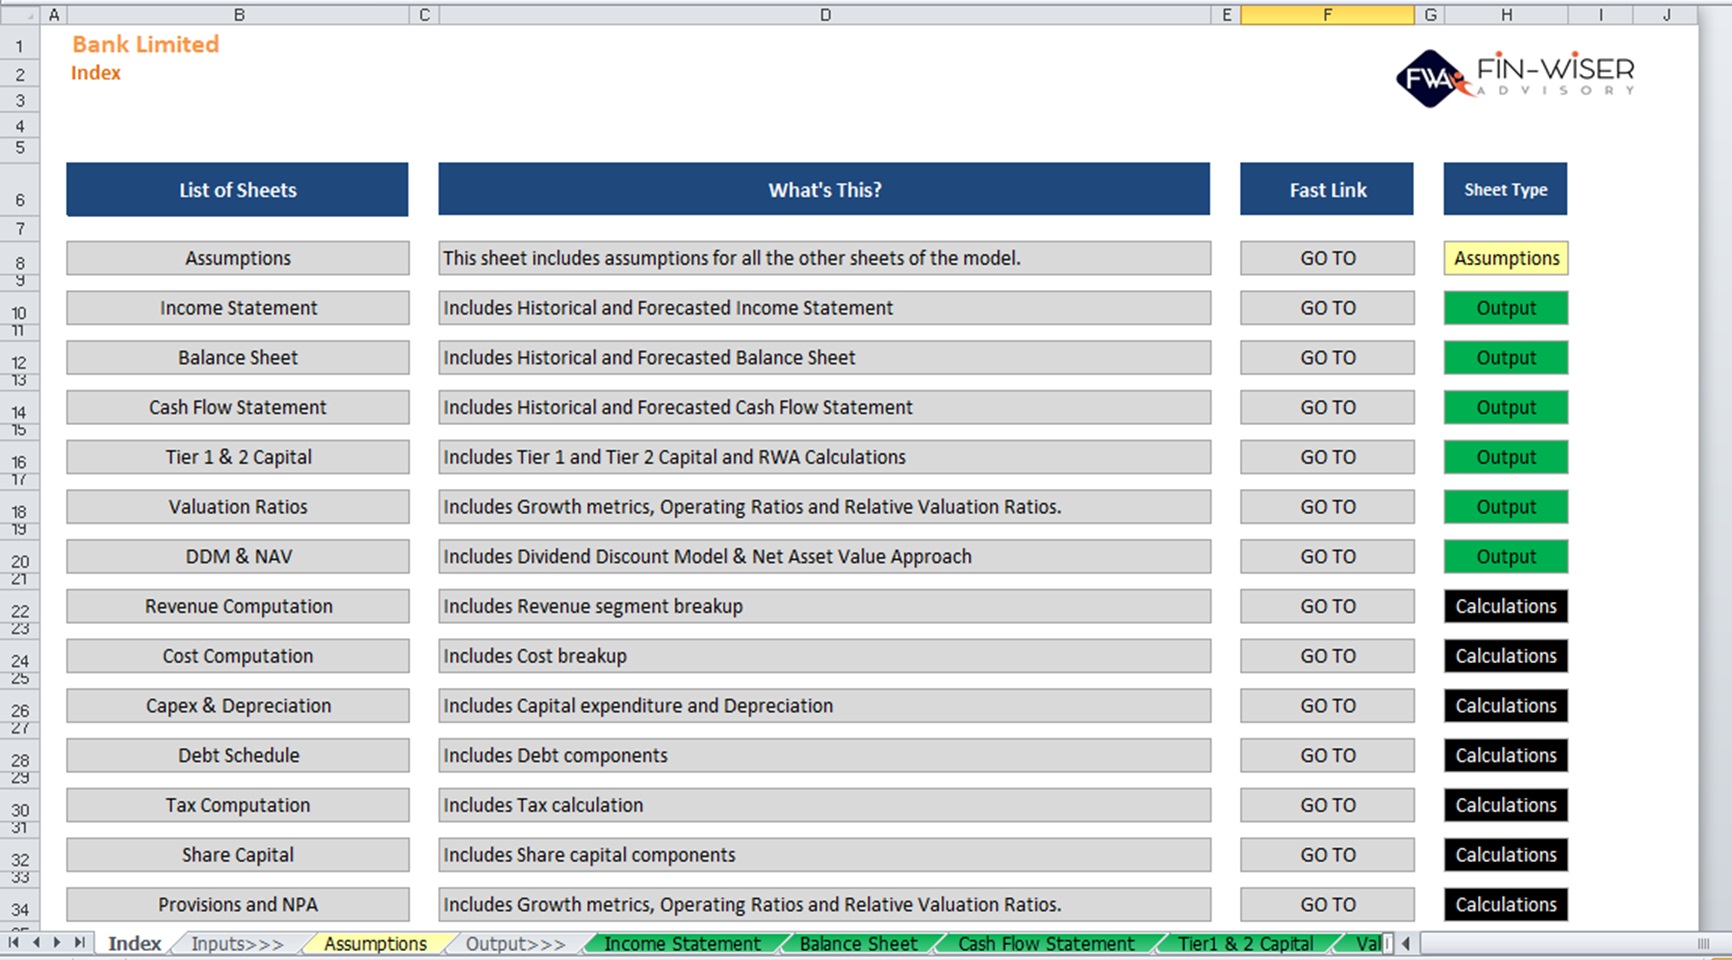
- Income Statement: Includes Historical and Forecasted Profit and Loss statement
- Balance Sheet: Includes Historical and Forecasted Balance sheet
- Cash Flow Statement: Includes Historical and Forecasted cash flows
- Valuation: DDM and NAV-based valuation
- Valuation Ratio: A very detailed financial analysis covering:
- Price-based valuation ratios
- Per Share Data like EPS, DPS, FCFF per share & more
- Profitability ratios
- Return ratios
- Dupont Analysis
- Growth Matrix
- Asset Quality
- Capitalization Ratios
- Liquidity Ratios
- Productivity Ratios

