In the modern finance world, data is the backbone of every strategic decision. Companies rely heavily on financial analysis to plan investments, manage risk, forecast growth, and evaluate business performance. One of the most powerful tools for performing these analyses is Microsoft Excel.Financial modeling allows professionals to create structured financial forecasts and simulate different business scenarios. Through structured excel financial modeling training, finance professionals learn how to transform complex financial data into actionable insights that support corporate strategy.
Why Excel Financial Modeling Training Is Important for Finance Professionals
Corporate finance professionals deal with large volumes of financial data every day. They must analyze revenue trends, forecast expenses, evaluate investments, and assess financial risks.Without proper modeling techniques, financial analysis becomes time-consuming and inaccurate. This is why excel financial modeling training plays a crucial role in developing advanced financial analysis skills.
Here are some key benefits of learning financial modeling in Excel:
Better Financial Forecasting
Improved Decision Making
Financial models provide a clear financial picture, enabling executives to make data-driven business decisions.
Investment Evaluation
Corporate finance teams use financial models to evaluate potential acquisitions, projects, or investments.
Risk Analysis
Scenario analysis helps companies understand the financial impact of potential risks.
Because of these advantages, financial modeling skills are considered essential for professionals working in corporate finance and financial advisory roles.
Key Components of a Financial Model in Excel
Before exploring advanced modeling techniques, it is important to understand the basic structure of financial models.
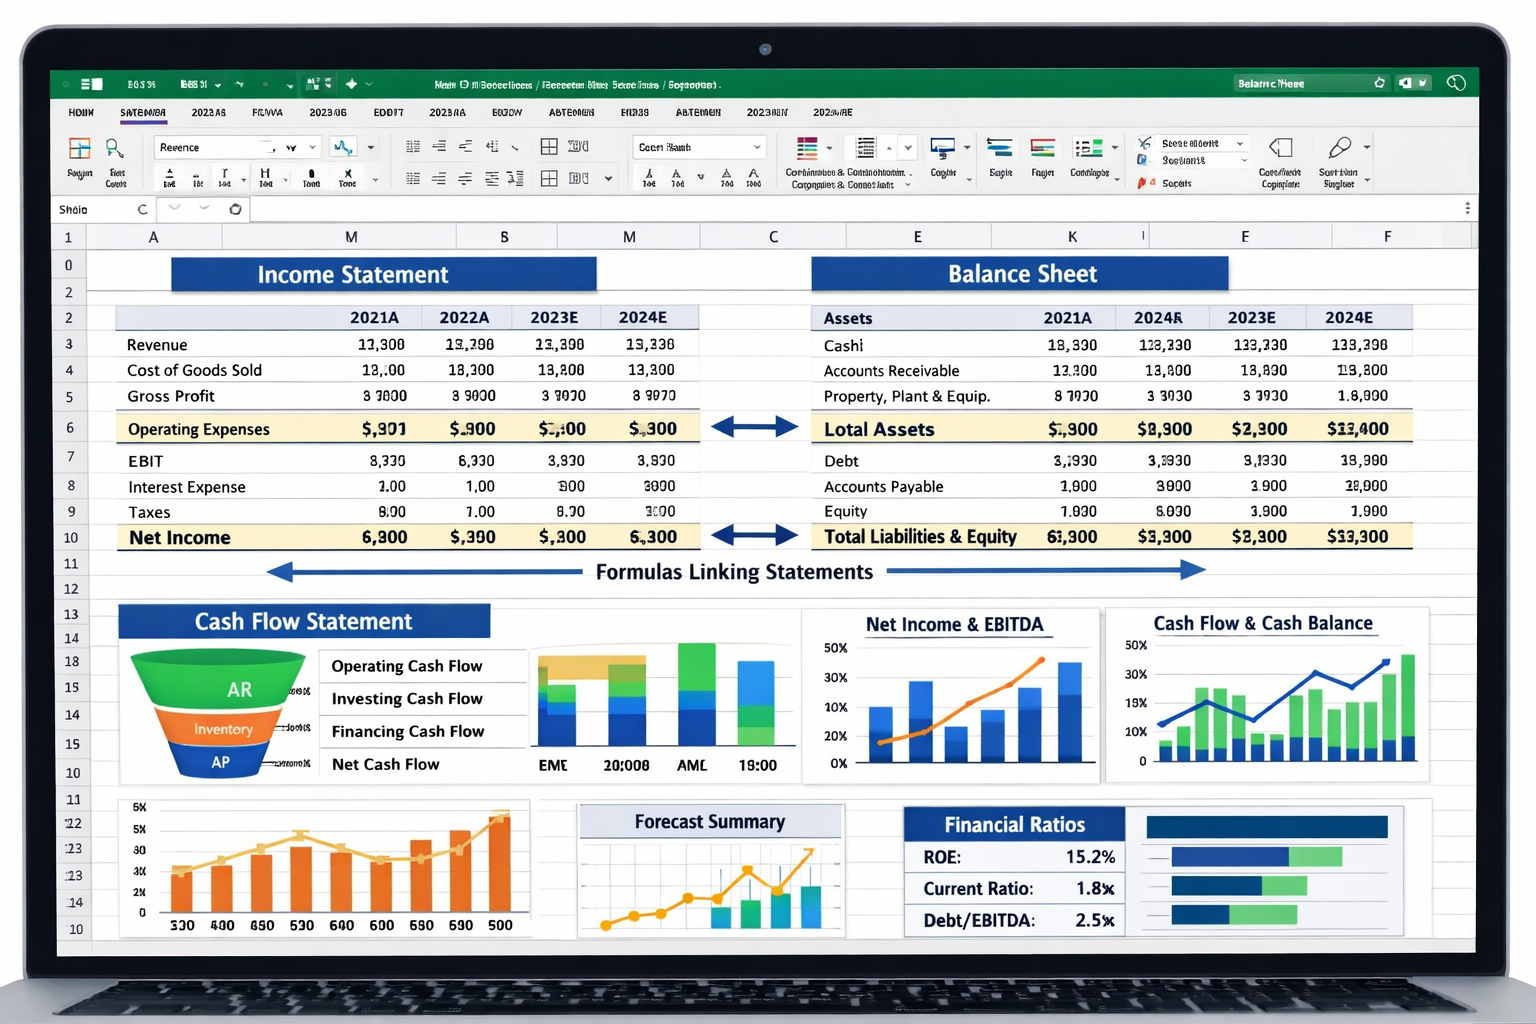
Most financial models are built around three primary financial statements:
Income Statement
This statement shows the company’s revenue, expenses, and profitability over a period of time.
Balance Sheet
The balance sheet displays the company’s assets, liabilities, and shareholder equity.
Cash Flow Statement
This statement tracks how cash flows into and out of the business.
These statements are connected together within Excel using formulas and financial assumptions. When one value changes, the entire model updates automatically.
This interconnected structure forms the foundation of financial modeling and is commonly taught in professional excel financial modeling training programs.
Best Excel Financial Modeling Techniques Used in Corporate Finance
Three-Statement Financial Modeling
The three-statement model is the most widely used financial model in corporate finance.
This model links the income statement, balance sheet, and cash flow statement into one integrated structure. It allows analysts to forecast financial performance based on key business assumptions such as revenue growth, operating costs, and capital expenditures.
Benefits of the Three-Statement Model
Supports strategic financial planning
Provides a comprehensive financial overview
Helps forecast business growth
Discounted Cash Flow (DCF) Modeling
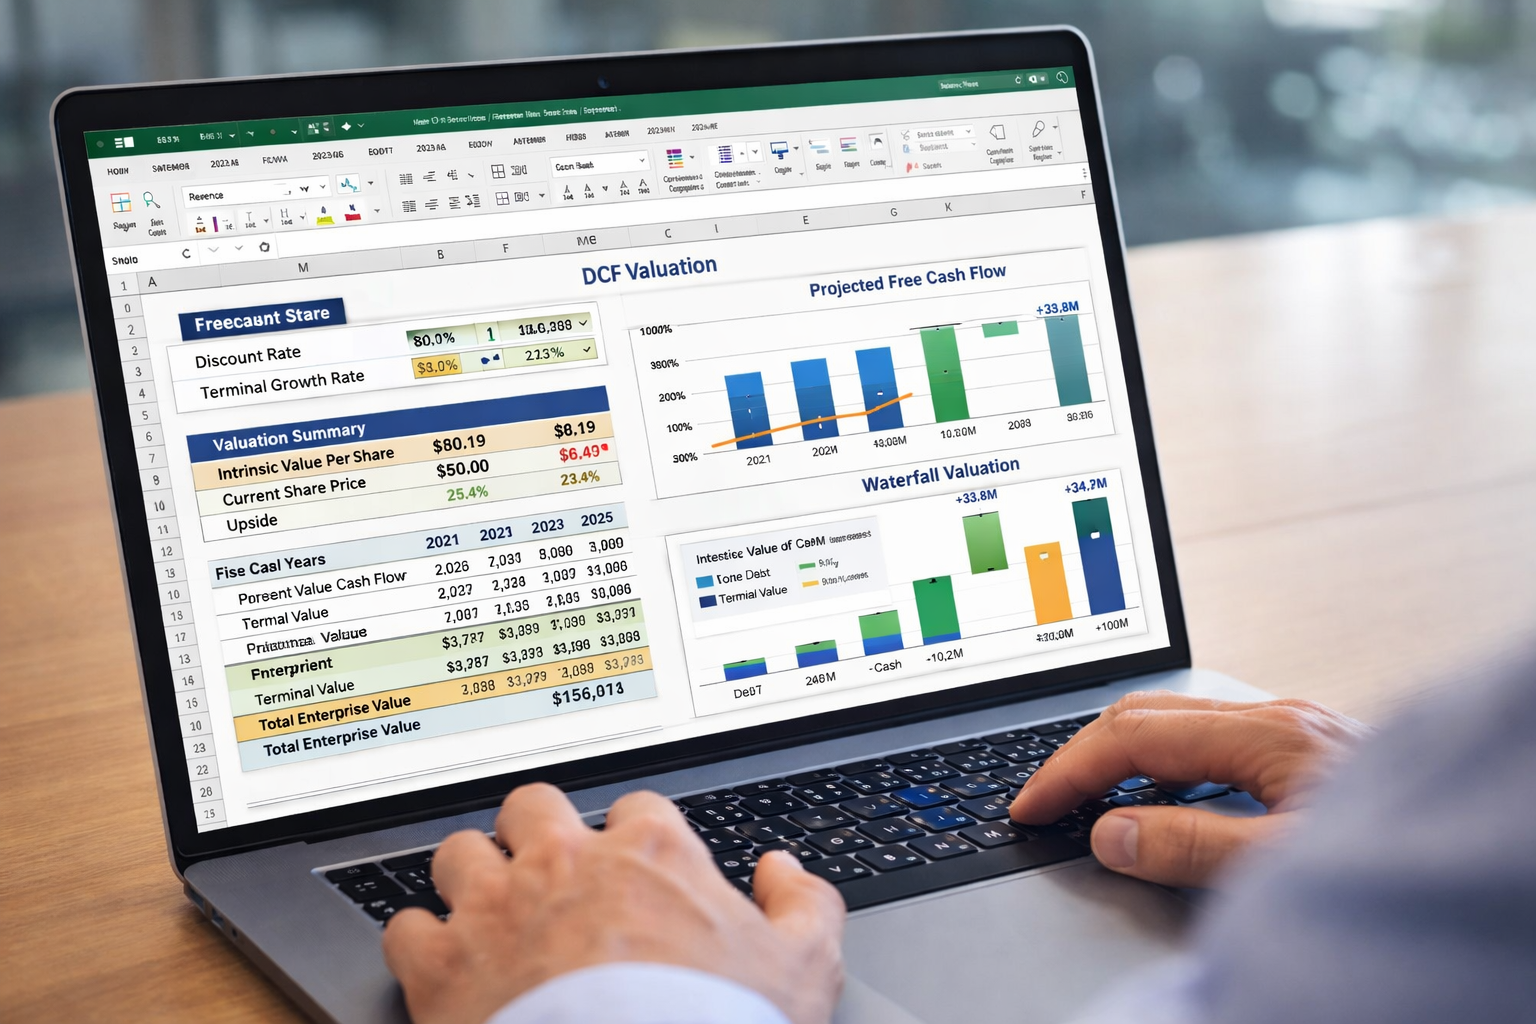
DCF modeling is a powerful valuation technique used to estimate the intrinsic value of a company or investment.
The model calculates the present value of future cash flows by applying a discount rate that reflects investment risk.
Key Excel Functions Used in DCF Models
- NPV (Net Present Value)
- IRR (Internal Rate of Return)
- XNPV
- XIRR
These functions help analysts calculate the profitability and feasibility of investment opportunities.
DCF modeling is commonly used by investment bankers, corporate finance professionals, and financial advisors when evaluating mergers, acquisitions, or capital investments.
Scenario Analysis and Sensitivity Analysis
Business decisions always involve uncertainty. Financial models must account for different possible outcomes.
Scenario analysis allows analysts to evaluate how financial performance changes under different assumptions such as:
- Revenue growth scenarios
- Cost increases
- Economic downturns
- Market expansion
Sensitivity analysis measures how a single variable affects financial results.
For example, analysts can examine how profit changes when sales growth increases or decreases.
Excel tools commonly used for these analyses include:
- Data Tables
- Scenario Manager
- Goal Seek
Comparable Company Analysis
Comparable company analysis is another important valuation technique used in corporate finance.
In this method, analysts compare a company with similar businesses in the same industry using financial ratios such as:
- Price-to-earnings ratio
- Enterprise value to EBITDA
- Revenue multiples
Excel allows professionals to create automated comparison tables that quickly evaluate valuation differences between companies.
This technique is frequently used in:
- Mergers and acquisitions
- Investment banking
- Equity research
- Corporate finance strategy
Leveraged Buyout (LBO) Modeling
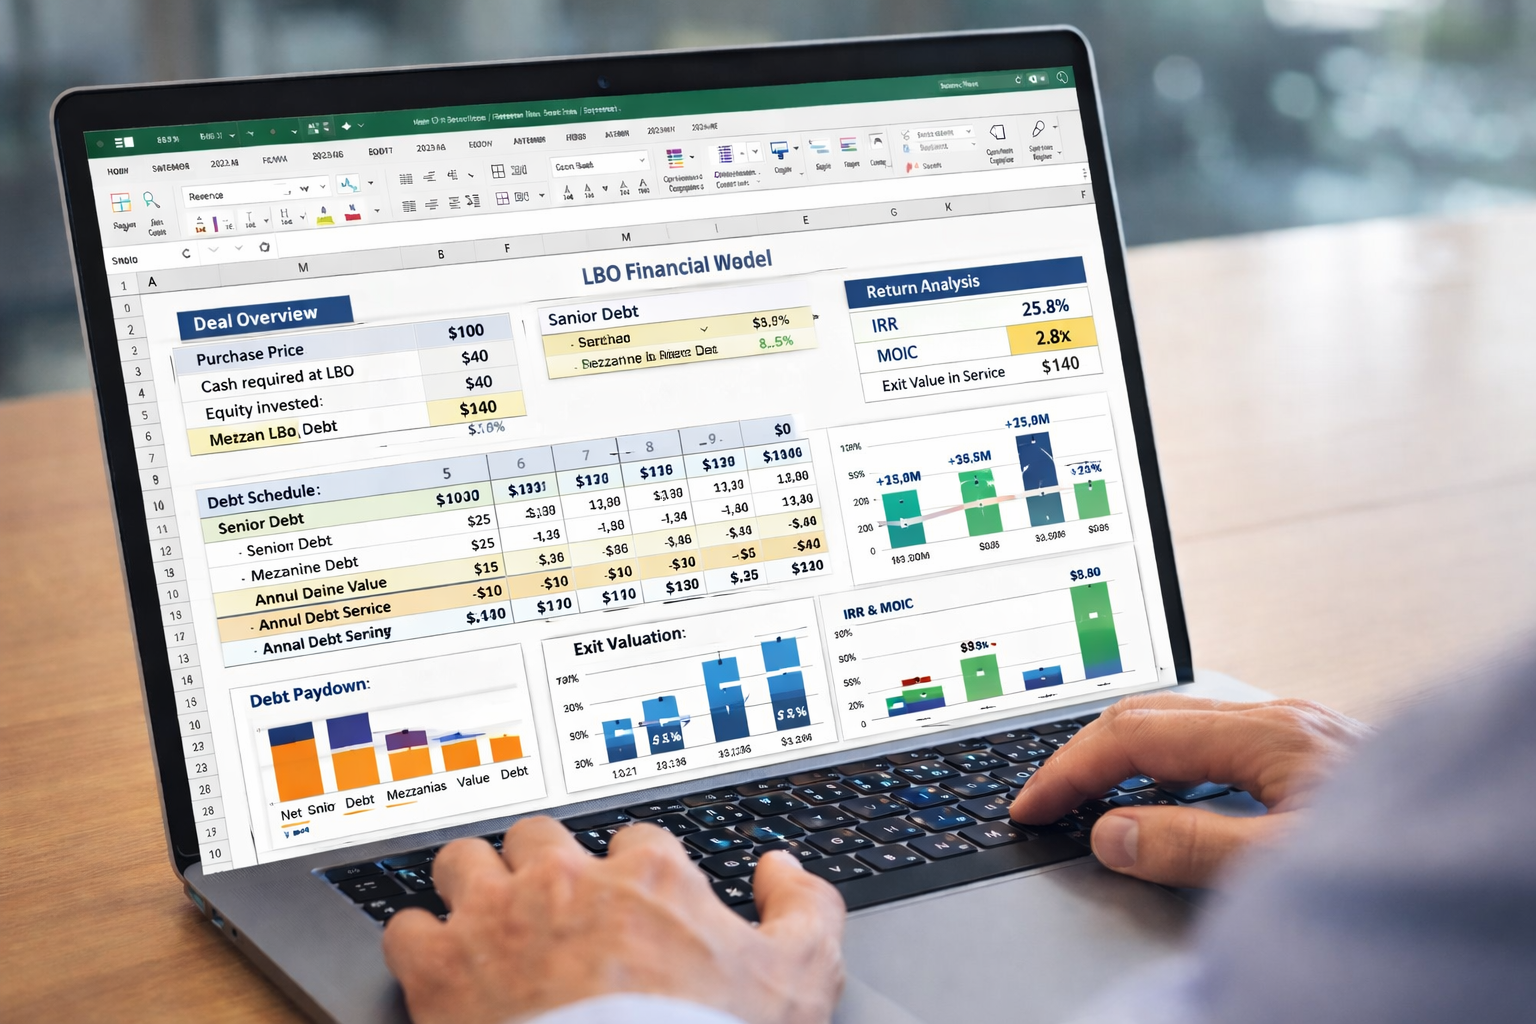
Leveraged Buyout models are used when investors acquire a company primarily using borrowed money.
This financial model helps investors determine whether the investment will generate sufficient returns to repay debt and deliver profits.
LBO models typically include:
- Debt schedules
- Cash flow projections
- Exit valuation assumptions
- Investor return calculations
Essential Excel Functions for Financial Modeling
Excel offers many functions that simplify financial calculations and forecasting.
Some of the most commonly used Excel functions in financial modeling include:
Financial Functions
- NPV
- IRR
- PMT
- RATE
Data Analysis Tools
- Pivot Tables
- Conditional Formatting
- Data Tables
Forecasting Functions
- FORECAST
- TREND
- LINEST
Best Practices for Building Excel Financial Models
Corporate finance professionals follow several best practices to ensure their financial models are reliable and easy to use.
Organize the Model Clearly
Separate assumptions, calculations, and outputs into different sections.
Use Consistent Formatting
Color coding helps users distinguish between input values, formulas, and outputs.
Avoid Hardcoding Values
Always reference input cells instead of manually entering numbers inside formulas.
Validate the Model
Check formulas regularly to ensure accuracy and consistency.
Maintain Model Flexibility
Design the model so assumptions can be easily updated.
Career Opportunities After Excel Financial Modeling Training
Financial modeling skills open the door to many high-value finance careers.
Professionals with strong modeling skills often work in:
- Corporate finance departments
- Investment banking firms
- Private equity companies
- Financial advisory firms
- Consulting organizations
Conclusion
Excel financial modeling is one of the most valuable skills in modern corporate finance. By mastering financial statements, valuation techniques, and Excel functions, professionals can build models that support business strategy and investment decisions.
Techniques such as three-statement modeling, DCF valuation, scenario analysis, and leveraged buyout modeling are widely used across the finance industry.