Understanding NPV and IRR
What is NPV (Net Present Value)?
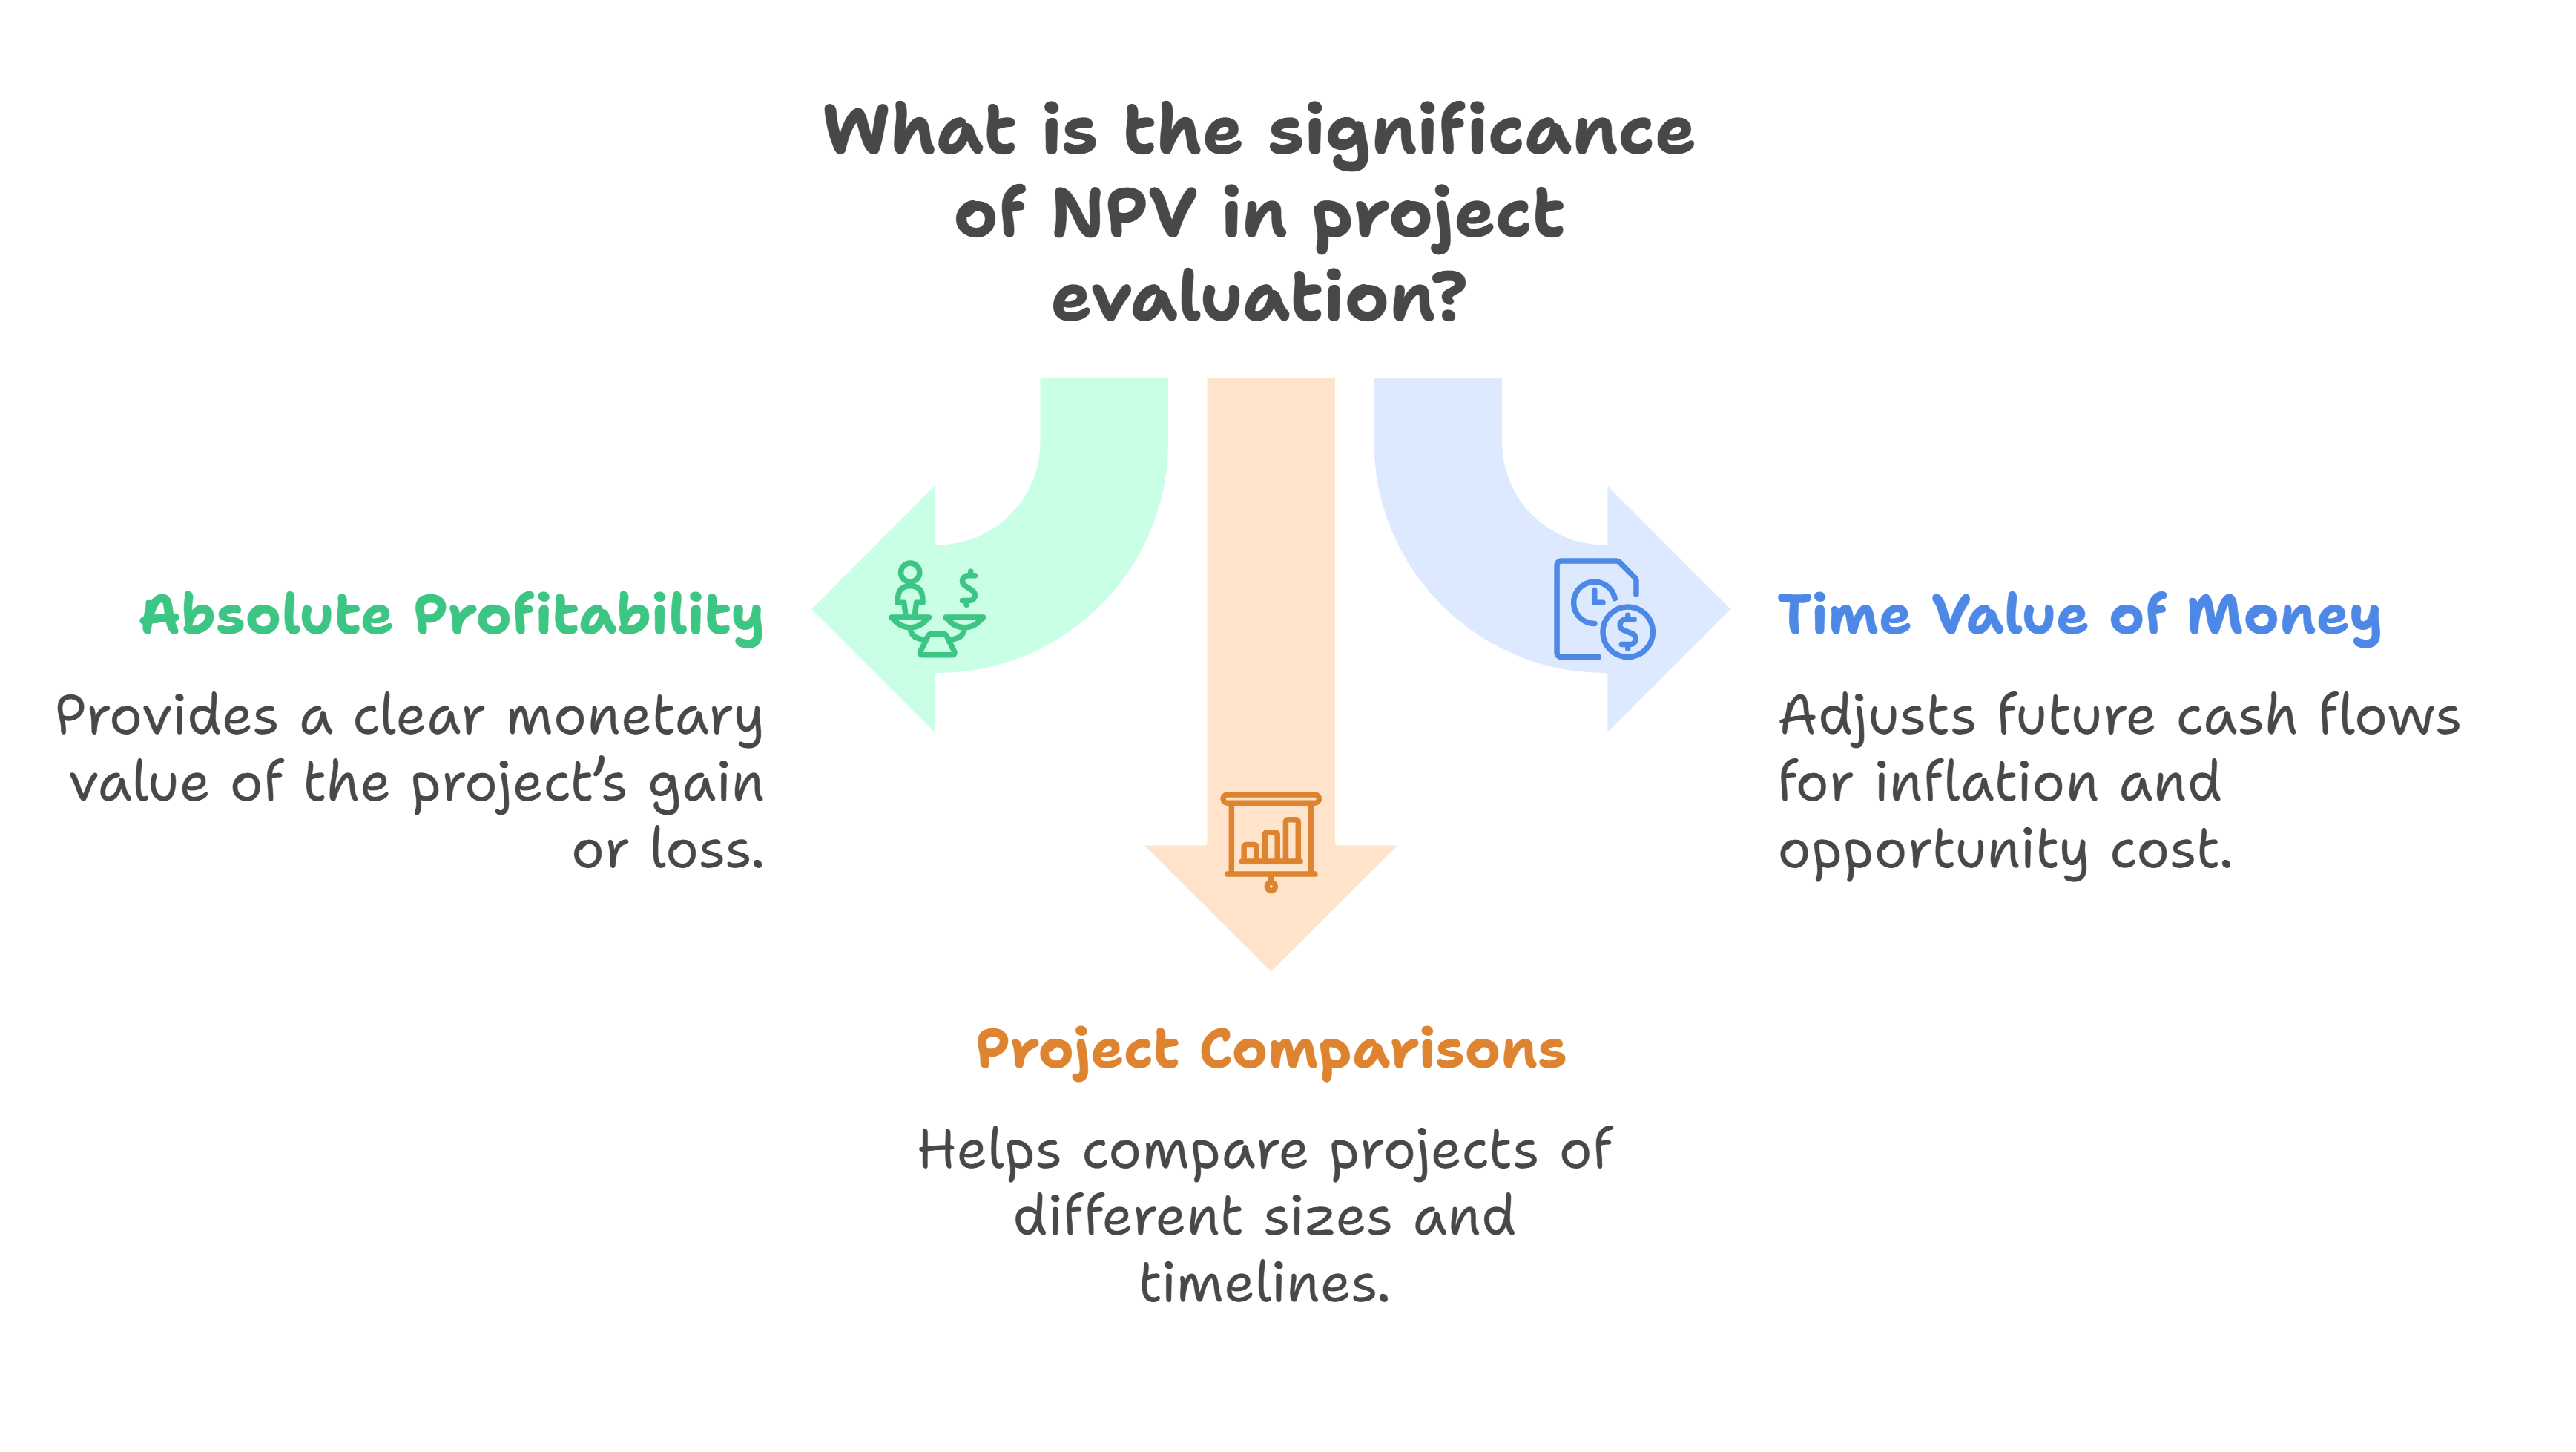
Net Present Value (NPV) calculates the net value a project generates after considering the time value of money. It measures profitability by discounting future cash inflows and subtracting the initial investment.
Why NPV is Important:
- Absolute Profitability: Provides a clear monetary value of the project’s gain or loss.
- Considers Time Value of Money: Adjusts future cash flows for inflation and opportunity cost.
- Reliable for Project Comparisons: Helps compare projects of different sizes and timelines.
What is IRR (Internal Rate of Return)?
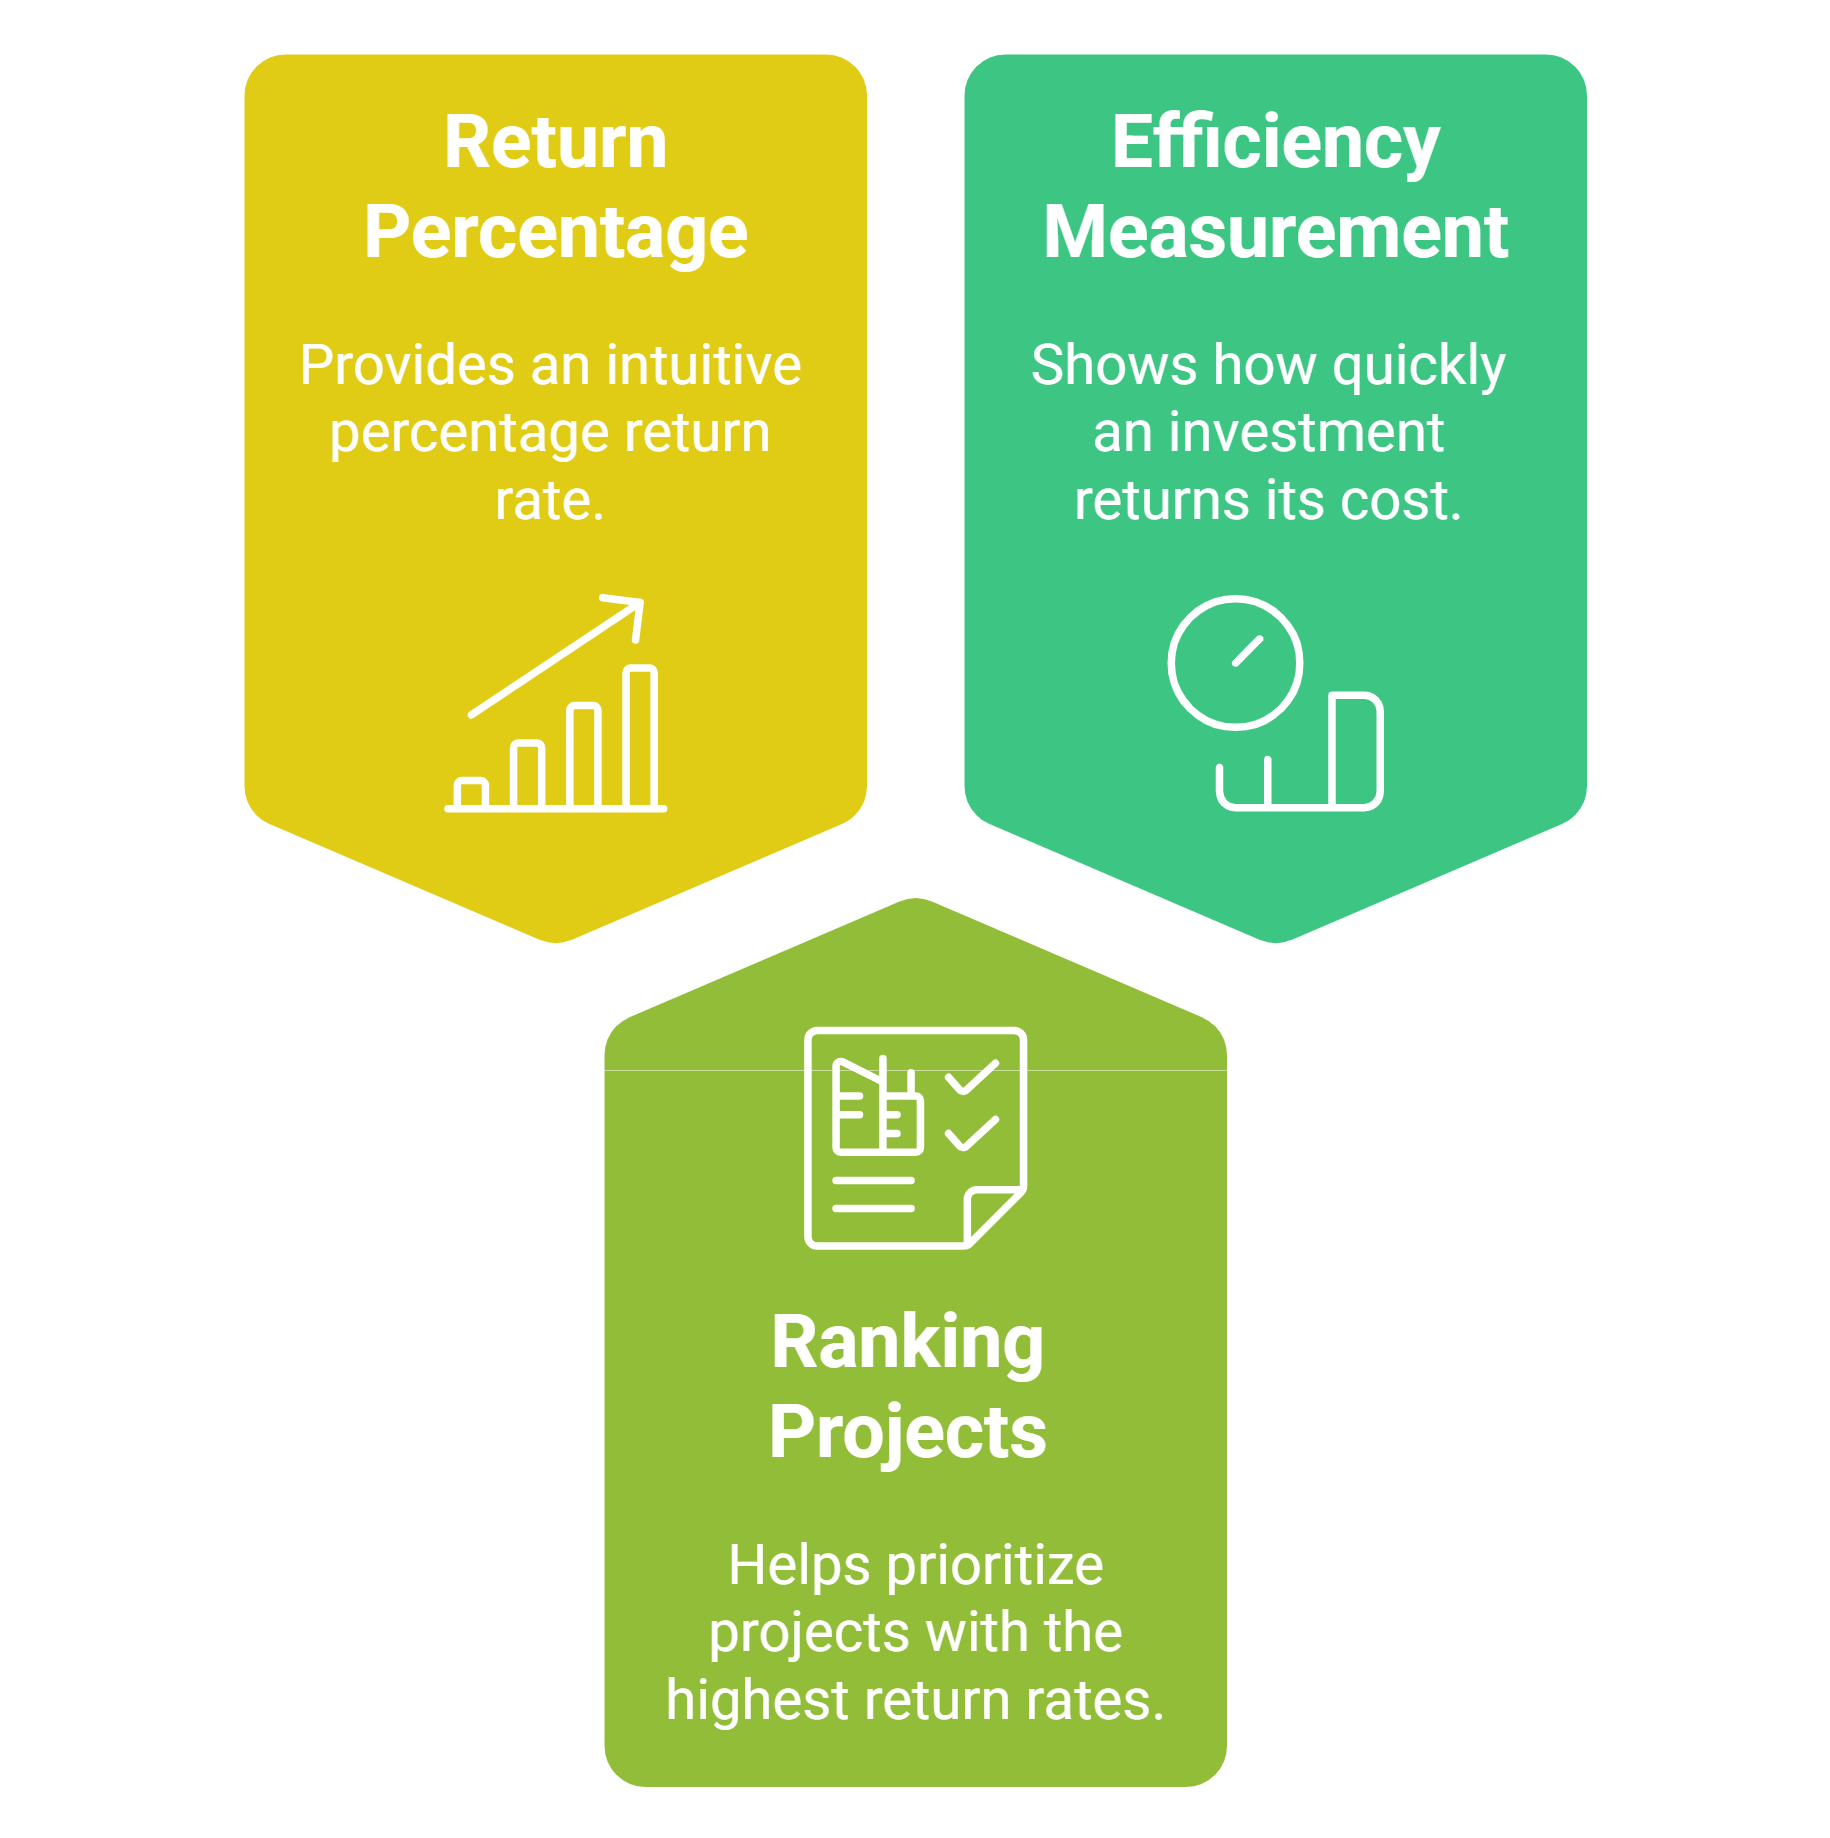
Internal Rate of Return (IRR) is the discount rate at which the NPV of a project becomes zero. It shows the annualized return a project is expected to generate.
Why IRR is Important:
- Return Percentage: Provides an intuitive percentage return rate.
- Useful for Ranking Projects: Helps prioritize projects with the highest return rates.
- Measures Efficiency: Shows how quickly an investment returns its cost.
Real-Life Comparison: Solar vs. Wind Project
Scenario:
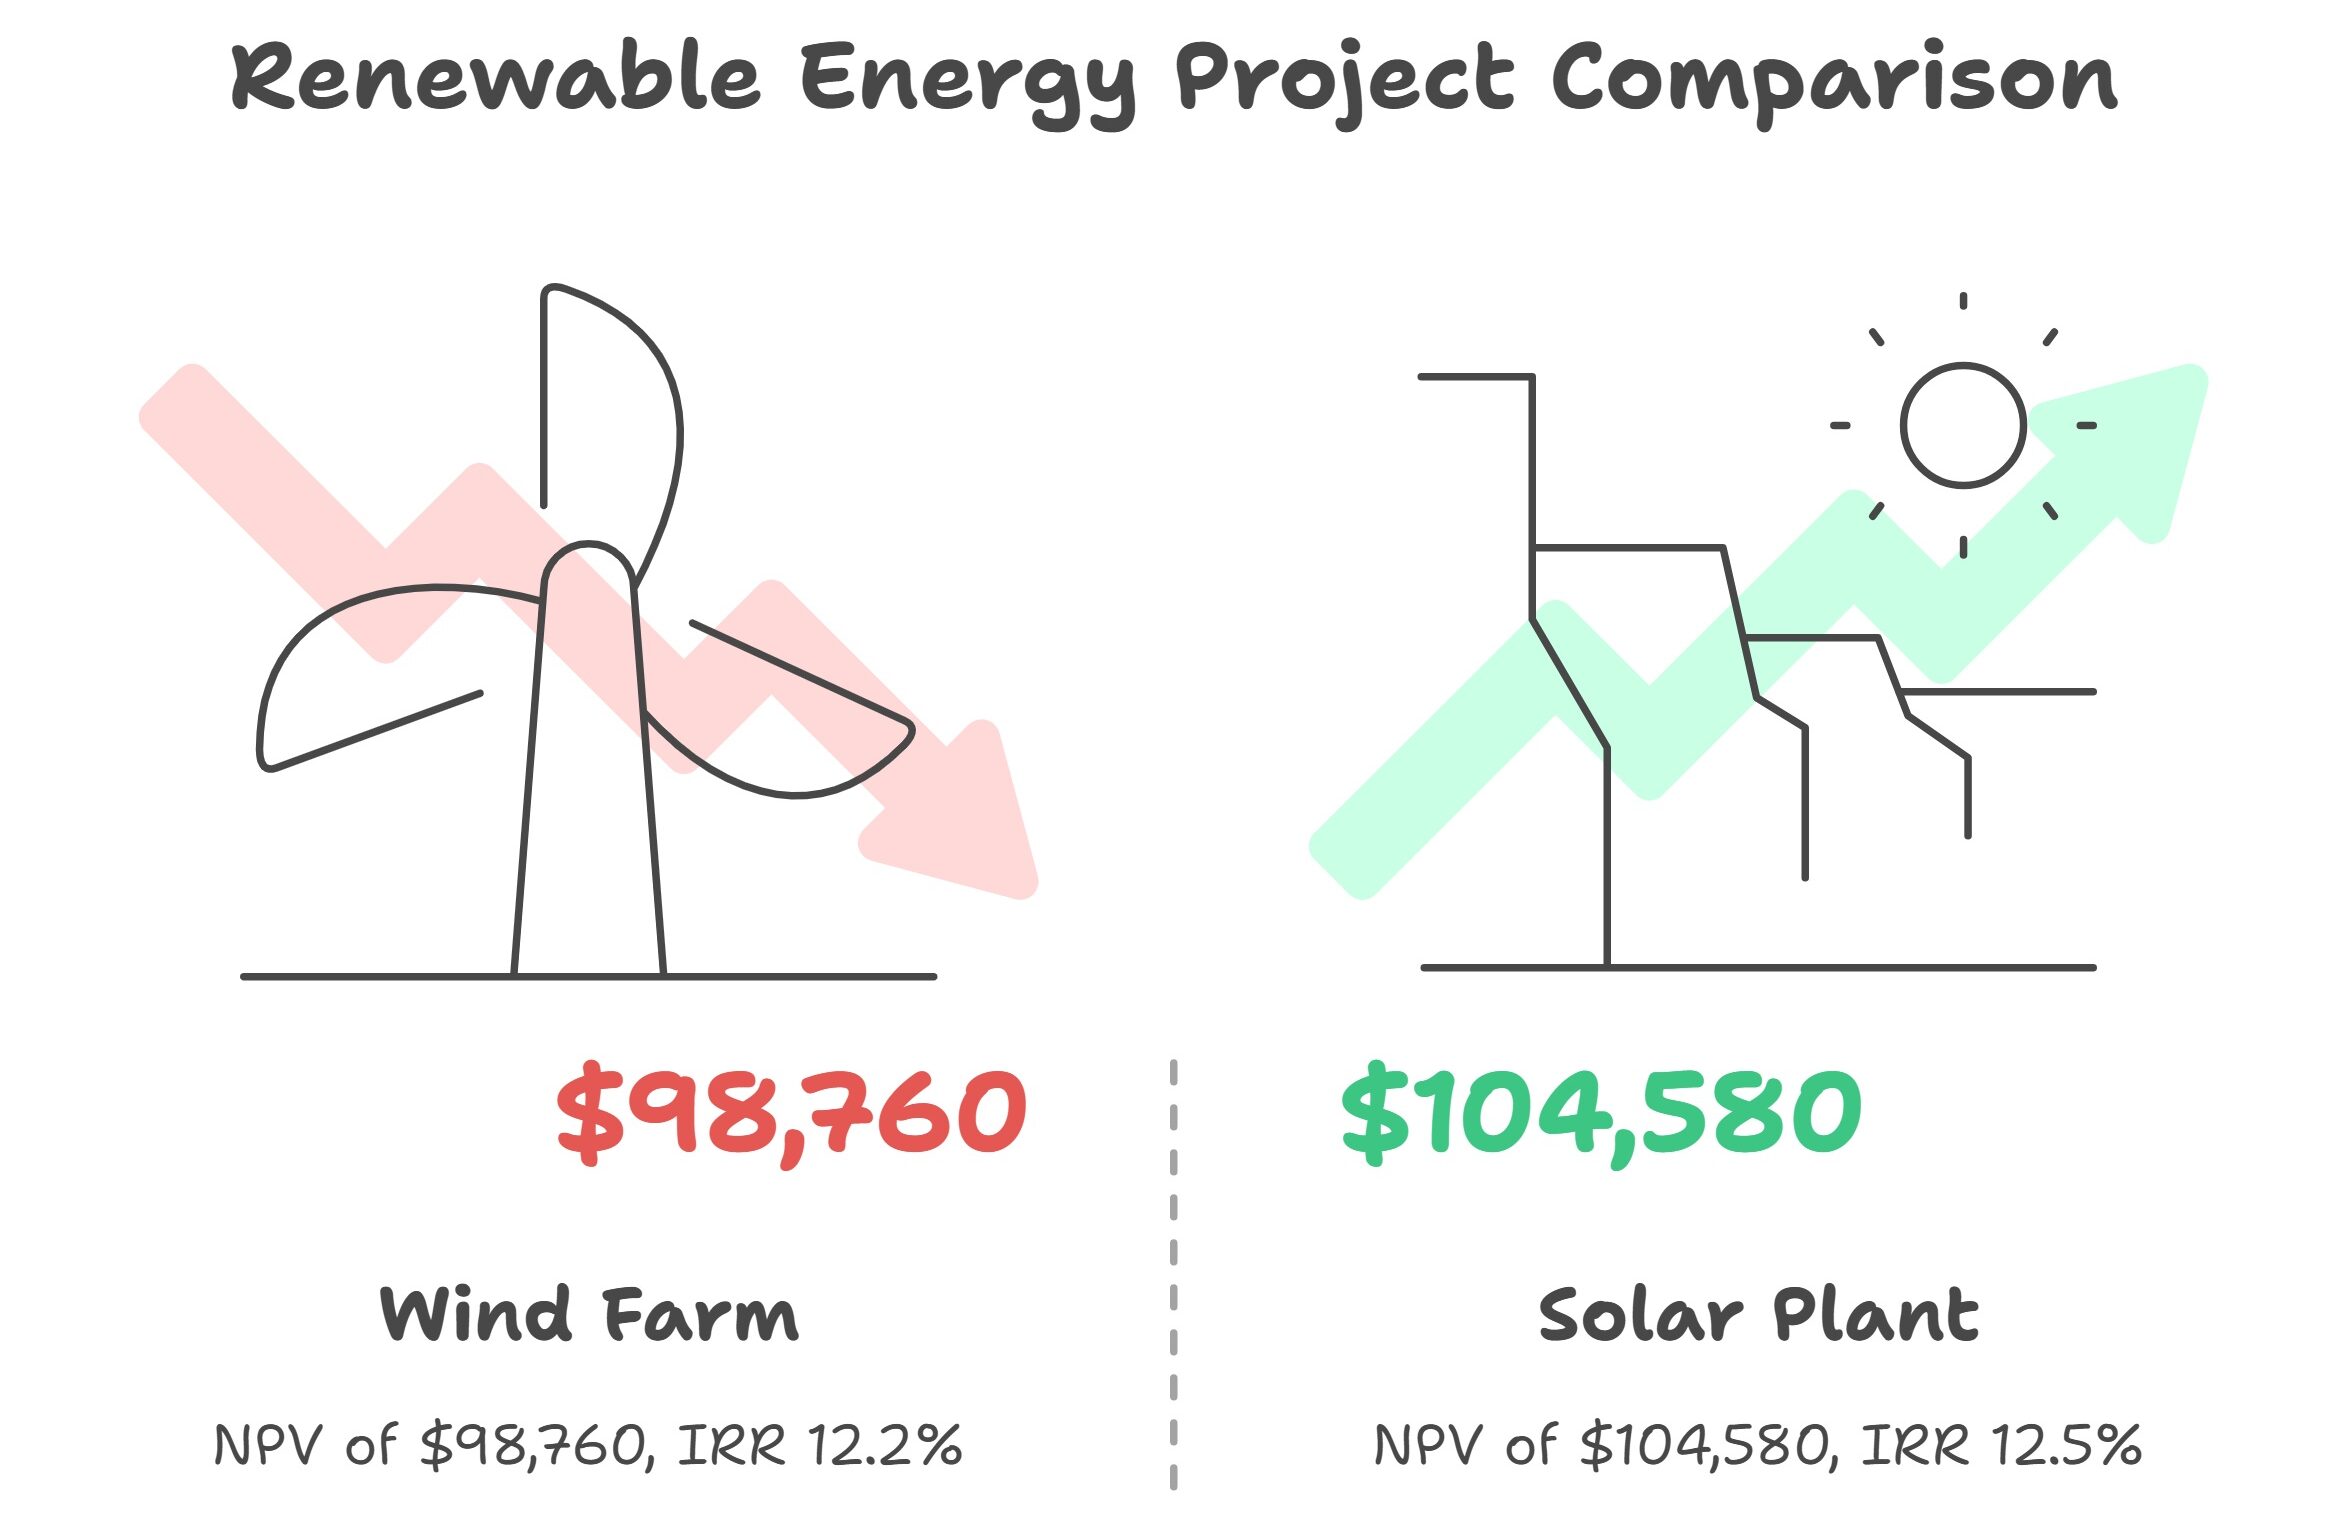
A company is evaluating two renewable energy projects: a Solar Plant and a Wind Farm, each requiring an investment of $1 million. The projects have a 5-year lifespan, and the cost of capital is 10%.
Annual Cash Inflows:
- Solar Plant: $250,000 annually
- Wind Farm: $240,000 annually
Results:
Solar Plant:
- NPV: $104,580
- IRR: 12.5%
Wind Farm:
- NPV: $98,760
- IRR: 12.2%
Decision Analysis:
- By NPV, the Solar Plant is the better option, generating $5,820 more value.
- By IRR, the Solar Plant also wins with
- a return rate of 12.5%.
Expert Insight from Fin-Wiser:
When both NPV and IRR point to the same project, the decision is clear. However, if they conflict, prioritize NPV, as it measures actual value c
reation.
NPV vs. IRR: Impact of Discount Rate Changes
The performance of the Solar Plant shifts as the discount rate changes, illustrating how capital costs affect profitability. Here’s a breakdown:
- At 8% Discount Rate: The NPV is highest at $130,450, reflecting greater value creation due to lower capital costs.
- At 10% Discount Rate (Base Case): The NPV is $104,580, aligning with the base scenario where the discount rate equals the cost of capital.
- At 12% Discount Rate: The NPV drops to $83,120, showing reduced value creation from increased capital costs.
Key Insight:
- As the discount rate increases, the NPV decreases, highlighting the sensitivity of project value to capital costs.
- The IRR remains constant at 12.5%, regardless of the discount rate, because IRR is the intrinsic return rate where NPV becom
es zero.
This analysis emphasizes why NPV should guide decisions when evaluating projects under changing financial conditions.
Common Pitfalls of NPV and IRR
1. Multiple IRRs Problem:
When a project has alternating cash flows (positive and negative), it may produce multiple IRRs, confusing decision-makers.
Solution: Use NPV alongside Modified IRR (MIRR) for clarity.
2. Reinvestment Rate Assumption:
- NPV assumes reinvestment at the cost of capital.
- IRR assumes reinvestment at the IRR itself, which is often unrealistic.
Solution: Trust NPV for large-scale projects, as it uses a more conservative reinvestment assumption.
3. Ignoring Project Scale:
IRR can favor small projects with quick returns, even if they generate less total value than larger projects.
Solution: Always review NPV for large projects to see their true value creation.
When to Use NPV or IRR (Expert Scenarios from Fin-Wiser)
1. Large Infrastructure Projects:
- NPV: Best for assessing overall value creation, especially for long-term investments.
- IRR: Less reliable, as it may misrepresent returns on large-scale projects.
2. Venture Capital Investments:
- NPV: Limited use for short projects, as it focuses on long-term value.
- IRR: Ideal for evaluating return rates and quick exit potential.
3. Short-Term Projects:
- NPV: Less suitable since it emphasizes long-term value.
- IRR: Perfect for comparing returns over short periods.
4. Comparing Similar Projects:
- NPV: Provides insight into actual value creation but can be more complex.
- IRR: Simplifies comparisons, especially for projects with similar sizes.
5. Irregular Cash Flows:
- NPV: More reliable because it accounts for variable cash flows without confusion.
- IRR: Can be misleading due to the possibility of multiple IRRs with non-standard cash flows.
Expert Insight from Fin-Wiser:
Use NPV for measuring total value creation, especially in complex or large-scale projects. Use IRR for quick comparisons, especially when evaluating short-term or multiple similar projects. When in doubt, prioritize NPV, as it directly reflects the project’s contribution to value creation.
Real-Life Industry Applications of NPV and IRR
1. Renewable Energy Projects
A leading energy firm used Fin-Wiser models to evaluate solar and wind projects. NPV highlighted the more profitable project, while IRR identified the faster return opportunity.
2. Mergers and Acquisitions (M&A)
An investment group used NPV to assess acquisition targets, ensuring long-term value, while IRR helped determine which deals would achieve faster payback periods.
3. Real Estate Investments
A real estate developer used IRR to compare short-term projects and NPV to evaluate the long-term value of commercial properties.
How Fin-Wiser Helps You Use NPV and IRR Effectively
At Fin-Wiser, we build advanced financial models tailored to your industry. Our models:
- Calculate NPV and IRR accurately with built-in sensitivity analysis.
- Visualize results with dynamic charts and dashboards.
- Compare multiple projects using both NPV and IRR side-by-side.
Explore our financial modeling solutions:
- Fin-Wiser – Expert financial solutions tailored to your needs.
- Fin-Wiser Online Store – Ready-made models for investment analysis.
Conclusion: NPV vs. IRR – Which Should You Use?
- Use NPV when you need to assess total value creation.
- Use IRR for quick comparisons between projects.
- Use both metrics together for a comprehensive investment analysis.
At Fin-Wiser, we help you not only understand these metrics but apply them to achieve smarter, data-driven investment decisions.